Best Ball Mania V Jaccard Similarities and Diversification Percentiles
Underdog released the Best Ball Mania V data last Tuesday, and it was like Christmas morning for best ball nerds! Best ball community hero Patrick Donovan (@Diablo_II on Twitter) got his incredible site BBMDB up and running with all the individual exposures, advance rates, roster combos, and more.
Best ball bros have seen their productivity drop by at least 10% last week, as they spent countless hours victory lapping their week two advance rates, mocking touts for their exposures, and realizing that they have one of just 241 teams with the combo of Achane-Rice-Mason.
I got busy working on calculating the Jaccard similarities of every 150 max drafter in the tournament, to determine who the most and least diversified drafters were.
If you haven't already read my articles on diversification in best ball, I'd recommend checking them out:
If you were a Sidekick tier subscriber, you probably already know what your diversification across your portfolio looks like, as you had access to our Jaccard tool during draft season.
We want everyone to get to see their diversification chart though, because it's an important metric through which you can view your best ball portfolio, and of course because it's fun!
Alright, that's enough foreplay, here's the good stuff. We'll start with the top 30 for both the most and least diversified drafters in BBMV:


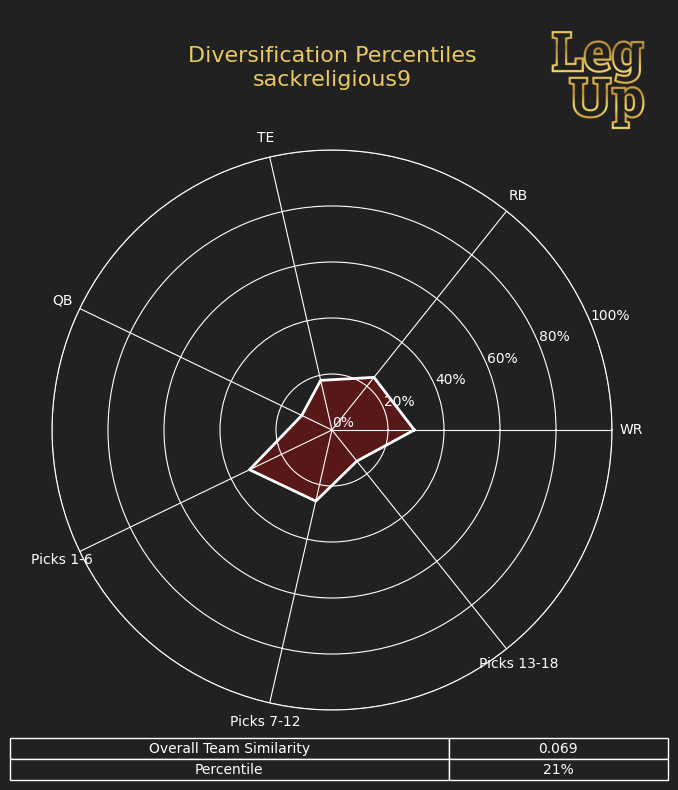
I'll share my Jaccard chart below, and summarize how to read it, so you have a better sense of how to interpret your own chart:

I came in with a Jaccard similarity coefficient of 0.069. This year that landed me in the 21st percentile for overall diversification. Last year the same value would have put me in the 28th percentile, so one take away could be that the field drafted more diverse portfolios this year compared to last.
There also were substantially more max entry drafters this season, with a total of 1,435 compared to just 851 last year. That's a 68% increase year over year, best ball is booming!
Last year my Jaccard similarity was 0.0636, which was in the 39th percentile. So why did I draft a less diverse portfolio this year? Last year some of the player stands I had the most conviction on were players going in the early rounds, like fading Austin Ekeler and Travis Kelce, and getting extremely overweight Breece Hall, Tyreek Hill, and Jaylen Waddle.
This year the players stands I had the most conviction on were going much later, like Jaylen Warren, Rico Dowdle, Drake Maye, and pretty much all of the Patriots.
Because of the large difference in draft capital, I was comfortable taking larger overweight positions on players with lower draft capital than I was players with higher draft capital last year.
You can actually see this intentional concentration among later draft targets on my diversification chart. When breaking down my diversification by rounds, I'm the most diversified in rounds 1-6, with the diversification progressively decreasing from rounds 7-12, and 13-18 where I had less than 20th percentile diversification.
You can probably guess that Drake Maye+Patriots stacks make up a large portion of the picks I made from rounds 13-18. You can also see that aspect of my portfolio reflected in my sub 20th percentile QB diversification.
But how can we use Jaccard similarity to help us become better informed drafters?
Let's think through a hypothetical. For purposes of this thought experiment let's assume that I have exactly zero player takes through the first six rounds, I think the market has priced every player in those rounds perfectly efficiently, and I want to have field neutral 8.33% exposure to every player going in those first six rounds.
If I still have the same chart as above with below 40th percentile diversification through the first six rounds, while having perfectly flat exposures, I know that I am unintentionally over concentrating the players that I draft together (likely based on how their ADPs naturally line up).
That means that even though I have perfectly flat exposures, I wind up taking certain players together far more frequently than others.
In general, think of your diversification percentiles as metric for how diverse your combinations are relative to how concentrated (or flat) your individual player exposures are.
I took pretty big stands across my entire portfolio, so relative to my individual player exposures, I am quite happy with my level of portfolio wide diversification.
The most important concept to grasp is that diversification is mostly a lever that impacts the risk on your portfolio. I touched on this in my previous articles, explaining that accepting risk was a perfectly fine thing to do in a portfolio, at least up to the point that we still get a benefit from increasing our risk.
Unnecessary Risk
Some players in the field still seem drawn towards accepting unnecessary levels of risk. Gluttons for punishment, they willingly (but perhaps ignorantly) march their portfolio toward the buzz saw, facing near certain obliteration. Their payoff when they are correct has the potential to be glorious, but in reality not much different than drafters who accepted far less risk.
To illustrate this concept, imagine a simple game where we roll a six sided die. I allow you to select one number, for a payout of 6:1, or three numbers, for a payout of 2:1. Both options have the same expected value of zero, but the single number option has significantly more variance.
The game we play has substantially more variance than just rolling a single die. Which begs the question: "If you could choose between two options with the same expected value, would you prefer the option with less risk, or more risk?"
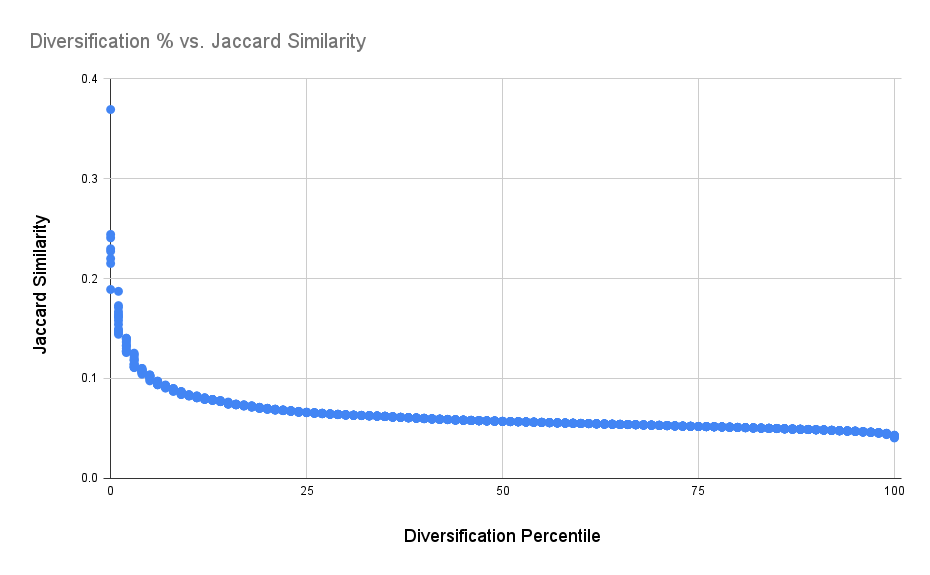
When we talk about the reckless drafter, it's easier if I show you rather than tell you:

The above chart illustrates that the least diversified drafters are substantial outliers compared to the other drafters. Right around the 10th percentile threshold is where we begin to see the Jaccard similarity really spike.
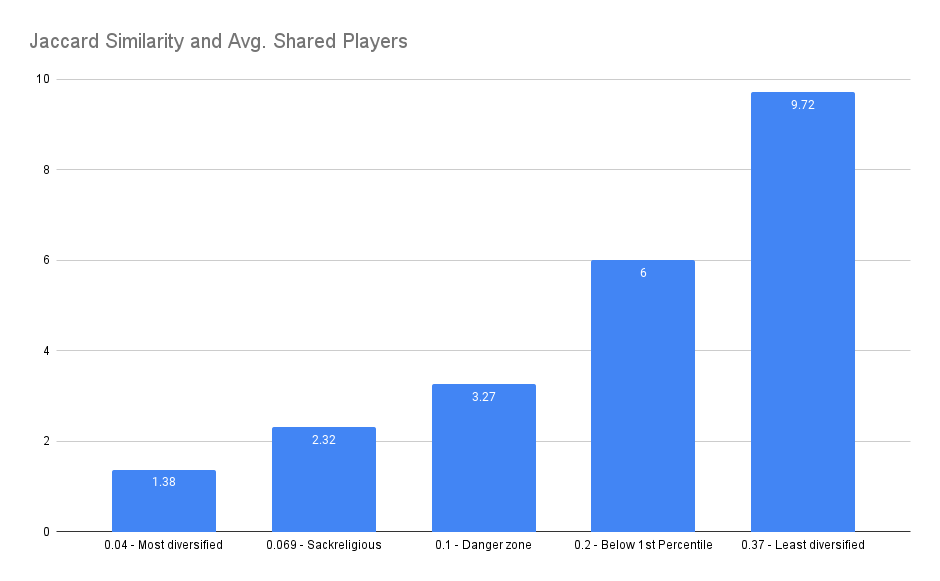
Let's provide a frame of reference for what different Jaccard similarity coefficients imply about a portfolio:

In the above chart we can see how many players any two teams from a portfolio would share on average given certain Jaccard coefficient thresholds.
In my previous articles on diversification, we explored the relationship between advance rate variance and Jaccard similarity. Given the above visual, it's easy to understand how your variance ramps way up when your teams share so many players on average.
Downloadable Charts and Data
Below I'm providing a zip file that contains the diversification charts for every max entry drafter in BBM5, as well as users that submitted their name to request their chart in the LegUp discord. I'm also including an excel file that has all of the Jaccard coefficients and percentile data for each drafter. Go nuts!


