Stop Playing It Safe: Why Apex Drafting Is the Key to Fantasy Football Success
Smoke stagnated, yellowing the upper half of a dimly lit hotel room. It was August 1963; rain-slicked Manhattan was boiling outside, a distant train screaming through the night somewhere beyond the window.
Three men from Oakland – each tied to the Raiders or Bay Area newspapers – were out on business with nowhere to be. Winkenbach hunched over the desk, eyes scanning notes on a legal pad, the creak of his chair occasionally popping and piercing the air above each man’s quiet consternation.
Stirling and Tunnel waited, cigars smoldering to their fingertips, the air thick with smoke, whiskey, and the sour sting of damp clothes from the afternoon’s rainstorm laid out to dry. A malfunctioning wall unit rattled like an impatient goon at the door. Stirling chewed a toothpick. Tunnel sipped his drink.
Winkenbach might have been insane, but his game had something – points, picks, rosters, a wild labyrinth of calculations. Finally, he cleared his throat and said another name: “John David Crow.” The sound lingered in the air for a moment or two, and then the whisper of pencils on paper followed.
No one knew it then – no one could have – but a pastime – an entire industry – took its first breaths in that still room in 1963. It was simply a way for these three men to kill a summer night away from home. To millions unaware, it was the birth of an obsession they were yet to discover.
FANTASY FOOTBALL HAS COME A LONG WAY SINCE 1963
Fantasy football strategy wasn’t always clear; for decades, it was a shopping spree held in the dark. When I started playing in 1991, few had analyzed the game in depth, leaving GMs to rely on instinct. Over time, groupthink has evolved in tandem with the game, shaping our modern strategic landscape.
In the early days, with no clear guide, I relied on my own reasoning to seek an advantage. By the mid-2000s, I was experimenting with a concept similar to Value-Based Drafting (VBD), unaware it had existed and been written about for some time.
Basically, I assigned each player a point value based on projections. Then, I compared that figure to the average startable or rosterable player, using the difference to determine the player's value relative to others. The core idea is to focus your draft on players expected to outperform their positional peers.
Many issues with VBD have been well-covered by now: projections are useful but incomplete, roster construction matters because some builds improve as the season progresses, and backup or committee players project lower, obscuring their true upside in the event their circumstances change.
However, through this research, I arrived at my core philosophical driver for every form of fantasy football that ever has been or ever will be.
APEX DRAFTING, AN UNDERRATED EDGE
There's a concept I’ve extensively written about that significantly increases win rates while minimizing risk. It should be foundational for all GMs everywhere. It’s been a game-changer for me – and, honestly, it’s a blast. I call it Apex Drafting.
Seek pathways to upside. Abandon safety.
That's it.
My work as a fantasy writer often reinforces my focus on discarding safety in fantasy football in exchange for the aggressive pursuit of potential upside. While this may seem reckless at first blush, I assure you it’s not; it’s actually a low-risk, high-reward philosophy.
Whether we realize it or not, having players near their positional apex determines success in fantasy football, across all formats, whether the payout is $3 million or $300, in managed leagues, best ball, dynasty, or daily. When we win, we’re executing this concept, whether intentional or otherwise. So, why not try to do it on purpose?
A LOGARITHMIC PATTERN, NOT A LINEAR ONE
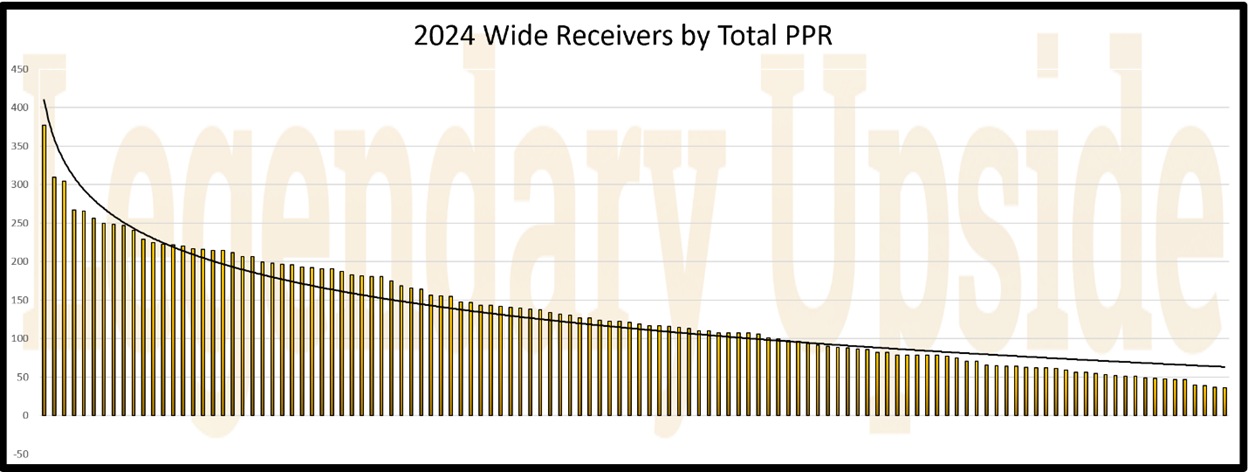
Many fantasy GMs assume the step down from X to X-1 in a position group (e.g., WR1 to WR2) is linear. This suggests the drop from WR1 to WR2 is the same as from WR20 to WR21, but that’s never the case. In reality, the decline is non-linear, with the gap between WR1 and WR2 typically far greater than that between WR20 and WR21. Likewise, WR20 to WR21 is usually steeper than WR40 to WR41. Visualized on a bar graph, the pattern looks more logarithmic than linear.
Simply put, top-ranked players create bigger point gaps than those ranked lower. WR1 and WR2 might be far apart, but WR20 and WR21 are much closer, and by WR40 and WR41, the difference is barely noticeable. Instead of a steady decline, the pattern starts abruptly and then flattens. Picture a steep mountain graduating into a less dramatic foothill.
The closer we get to the top end of the graph, the head, the bigger the advantage. The more we pull away from the head, the more things flatten. This is the tail.
Let me be very clear: the tail doesn’t really matter. Pursuing safety doesn’t win in fantasy football; it’s a fool’s errand. We want to go head-hunting—selecting players nearer to the head of the graph, forsaking all players we perceive as likely to end up in the tail.
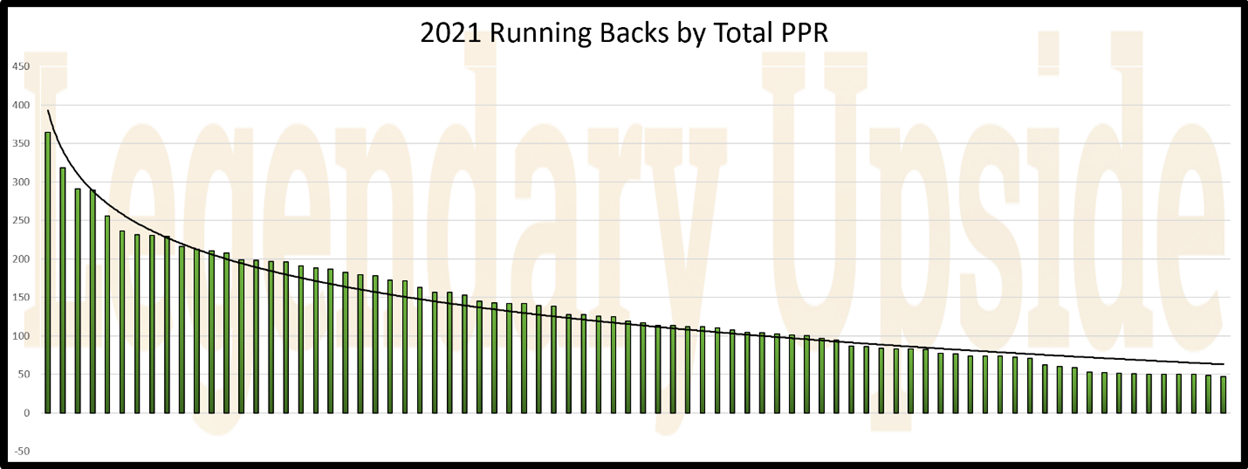
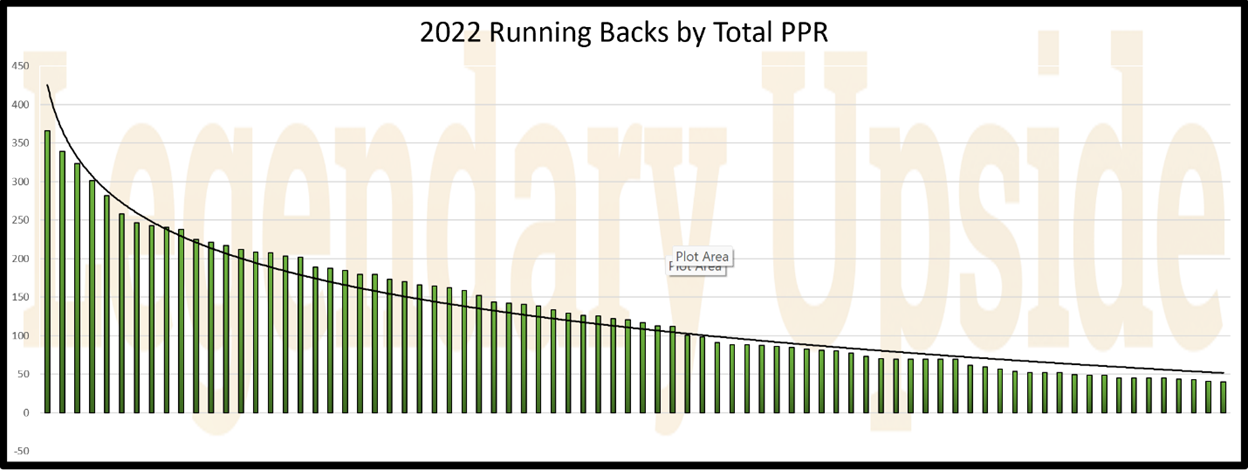
THE PATTERN IS UNIVERSAL TO ALL POSITIONS ACROSS ALL SEASONS
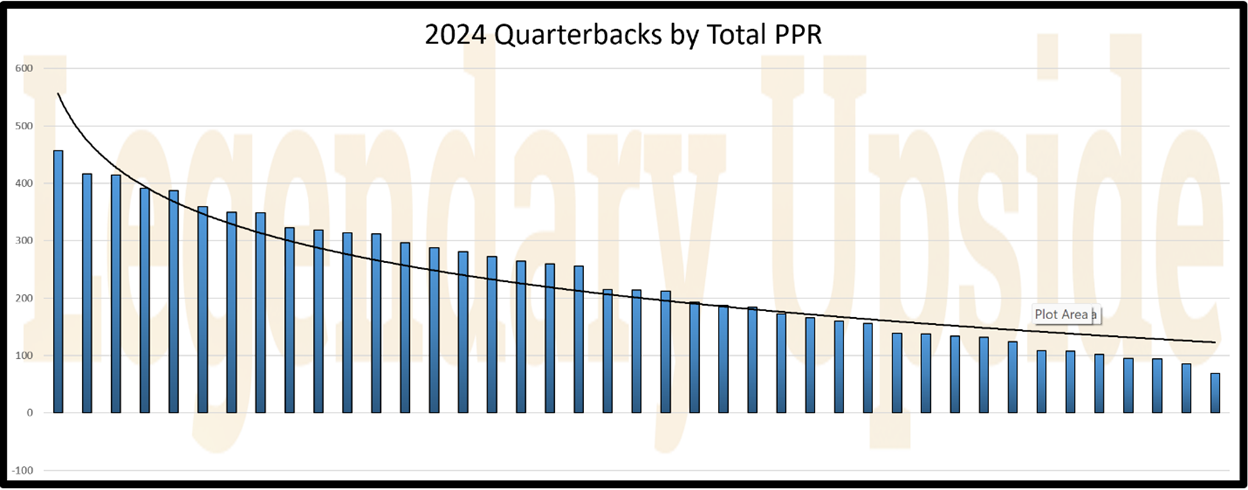
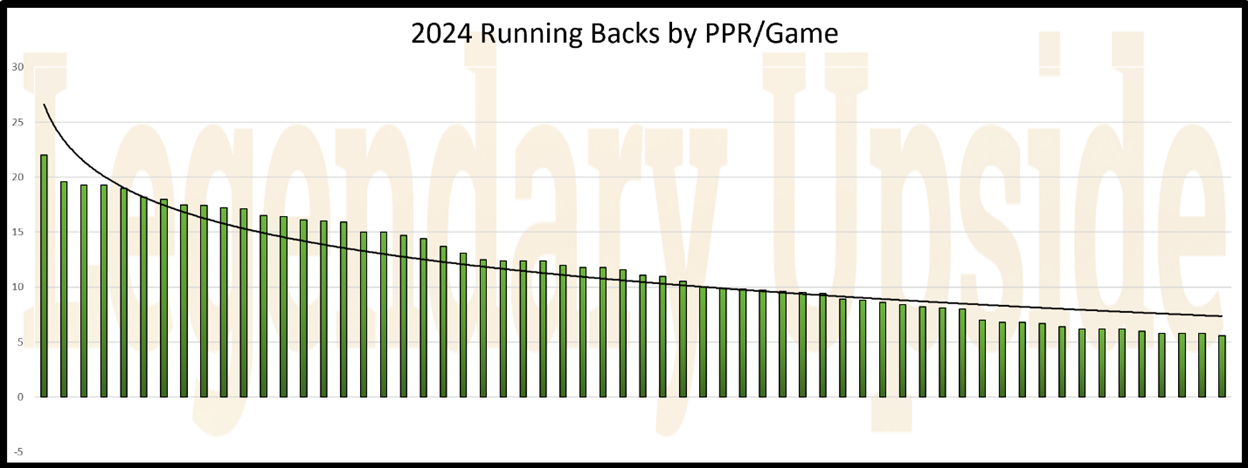
In 2024, the effects were more subtle at QB and, to some degree, RB. Based on my years of observation, this is somewhat anomalous. Numbers naturally fluctuate, so this is bound to happen. The effects are still present - just more subdued than usual, especially at QB.
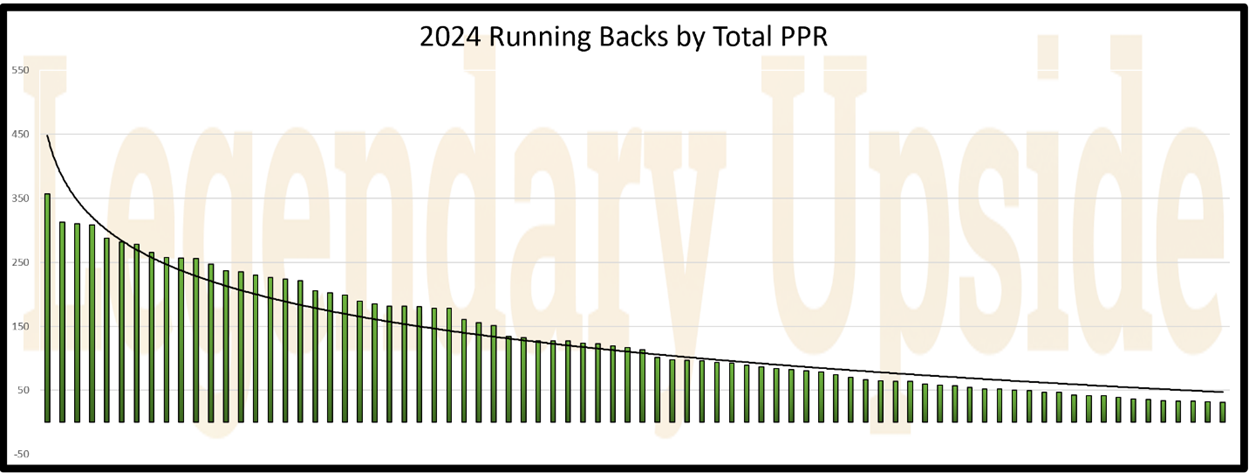
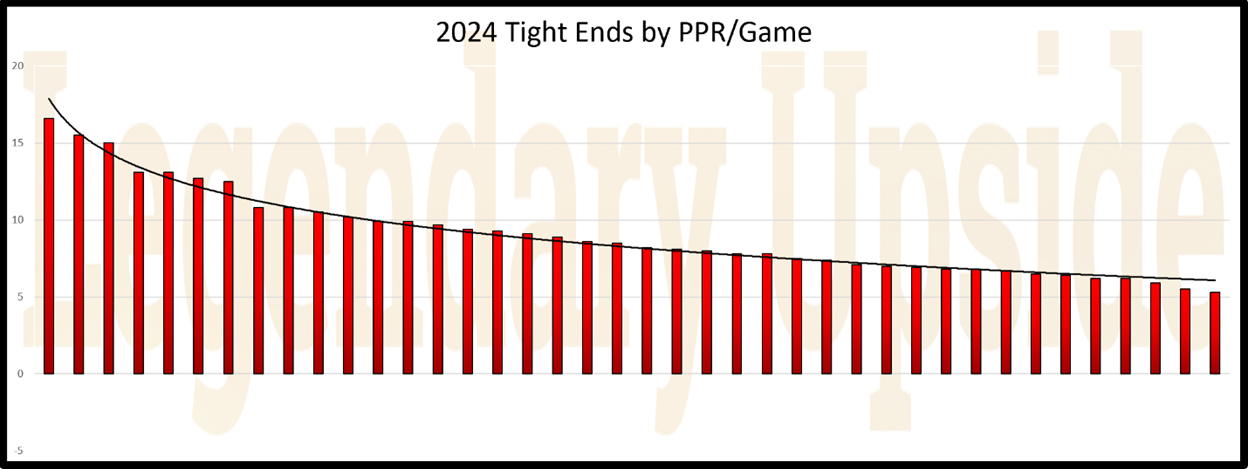
At WR and TE, the pattern is far more apparent. This aligns with what we would expect annually from each position.
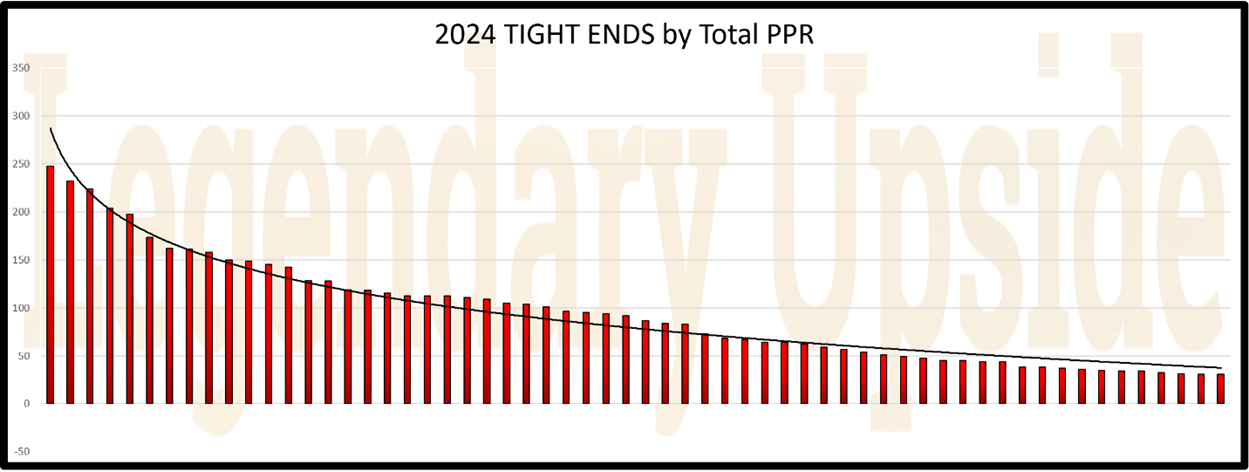
This pattern occurs in some form every year and at every position, without exception.
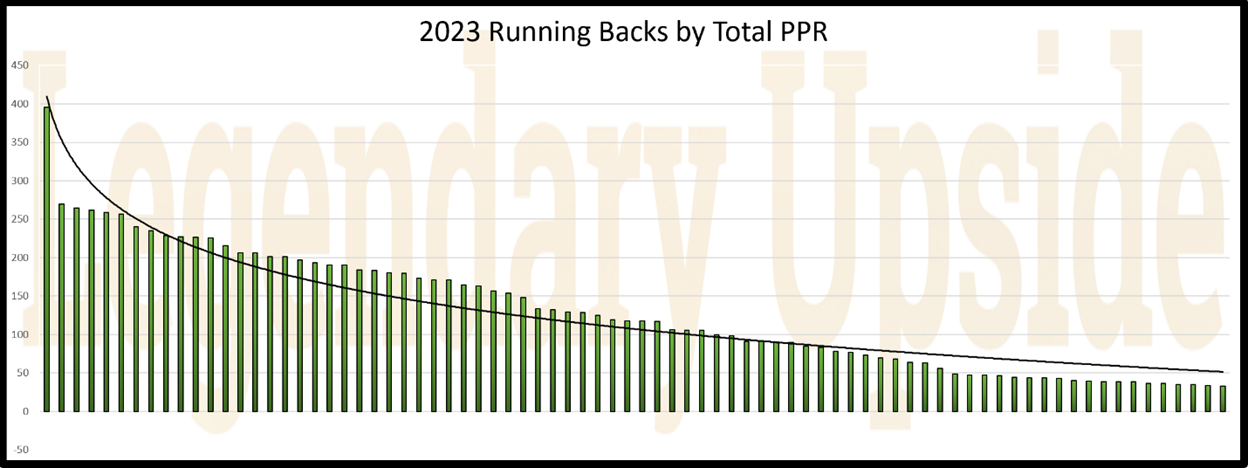
There’s little difference between Total PPR and PPR/G.
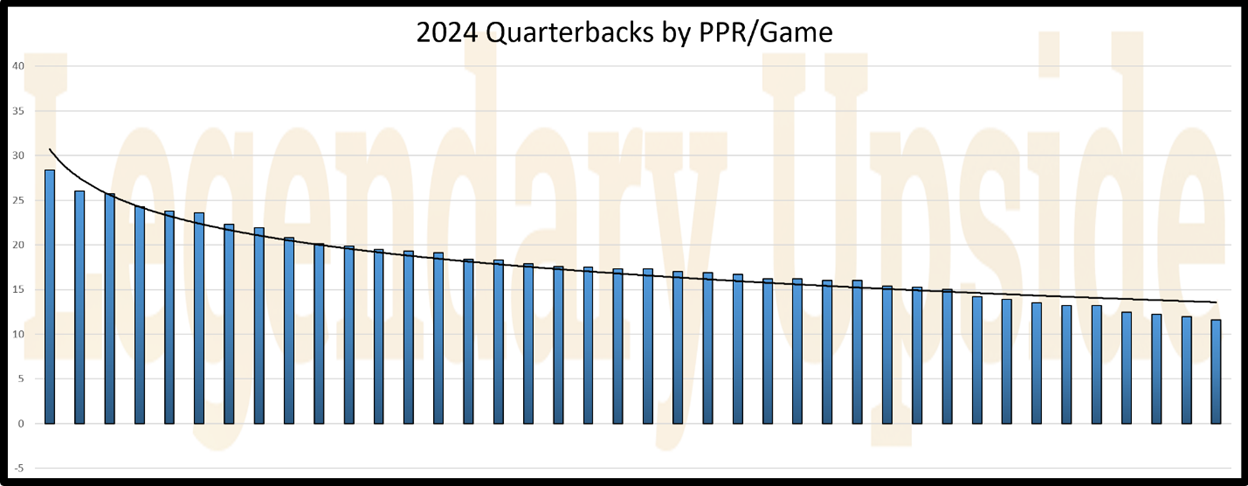
The same discrepancy appears per game at QB and RB in 2024, aligning with the slight anomaly we observed in Total PPR for these positions. This should be of little surprise, as it essentially has the same inputs as the season-long dataset.
However, as seen with Total PPR, the pattern is again more pronounced in PPR/G at WR and TE this year.
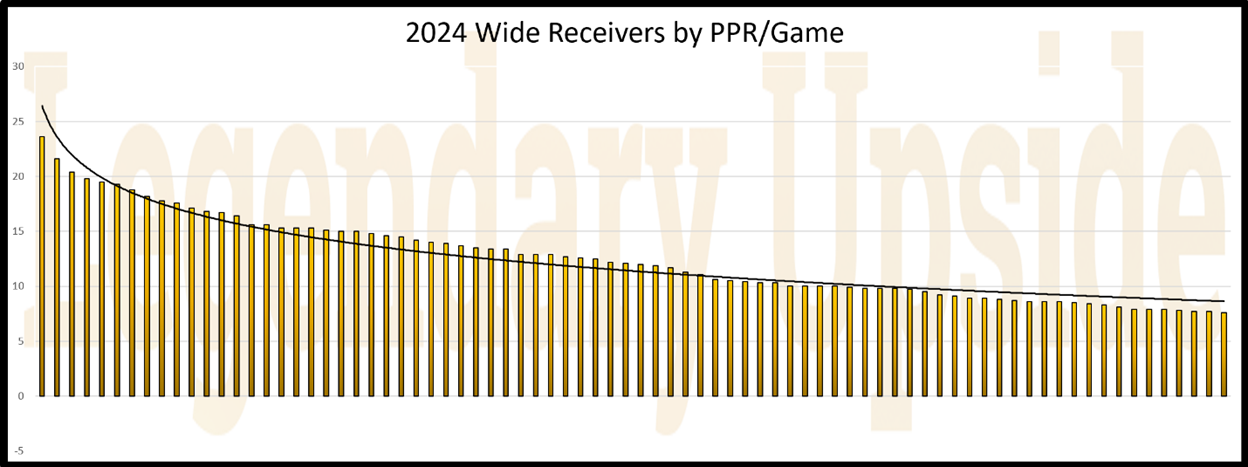
THE ADVANTAGE THIS EXPOSES
If we isolate the 2024 wide receivers, we discern a clear advantage conferred upon the three players within the green triangle: Ja’Marr Chase, Justin Jefferson, and Amon-Ra St. Brown, each of whom greatly surpassed the linear trendline in 2024. This is the section I call the positional apex. In a perfect world, we are always shooting for this zone.
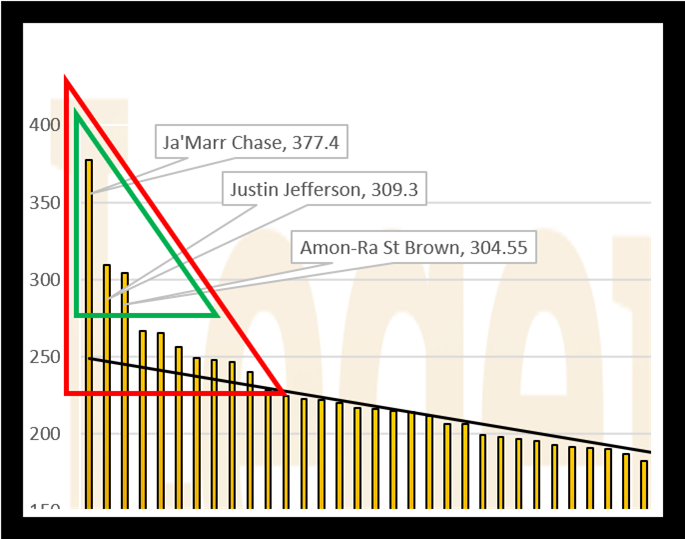
Seven additional players are above the trendline, meaning they offer a meaningful advantage over the other WRs before it falls into a more linear pattern.
I postulate that Rashee Rice and Puka Nacua might have landed in this range last year – possibly even in the apex – if not for shortened seasons. Stefon Diggs, Cooper Kupp, and Chris Godwin all had promising stretches of elevated production but saw their years interrupted. Brandon Aiyuk feels like a less realistic case, given his underperformance before the injury, following a slow start from the holdout. However, he would’ve been viewed as a candidate last summer. And who knows – maybe he would’ve caught fire if he’d stayed healthy.
I’ve highlighted the players above the trendline with a red triangle; there is still an advantage in having players in this range. The best player in this range is WR4, Brian Thomas Jr., who scored 266.7 PPR, 110.7 fewer than Chase, despite being just three spots lower in rank.
To match the PPR drop-off from WR1 to WR4, you’d have to go from Thomas at WR4 to Rashod Bateman at WR40. In other words, the difference between WR1 and WR4 in 2024 was the same as that between WR4 and WR40.
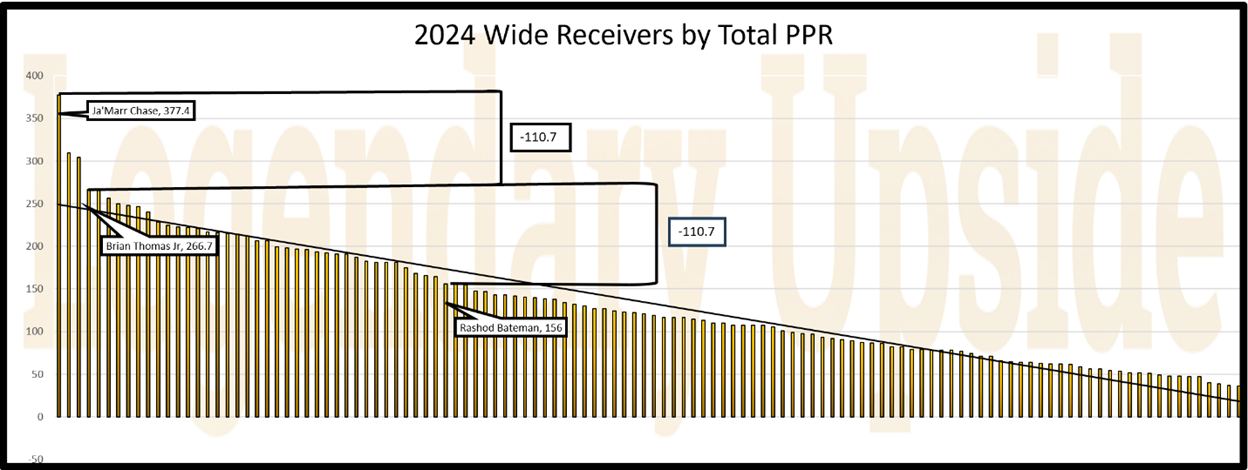
This should tell you we overemphasize the discrepancies between players outside of the WR10-15 range (or corresponding ranges in other positions). Small gains can be made in the tail, but they are minimal compared to landing players who outperform the trendline. Securing an abundance of these players puts us in a prime position to win.
Sometimes the tiers are more gradual; there may be up to five or six WRs at the positional apex in select years, and as many as 15 above the trendline. The key is to aim high and secure as many as possible, because these zones are where the biggest edges lie, with exponential gains the closer we get to the head.
Often, aiming for safety and achieving it yields a similar result to aiming for upside and missing. The players you take upside swings on frequently end up in the same range as those drafted for safety anyway; as such, there is no real advantage to chasing high-floor, low-ceiling profiles. This gives us the freedom to seek only upside.
For example, George Pickens was one of my bigger upside misses in 2024. He was drafted at 62.8 in FFPC redraft ranks from August 1 to September 5, the day the season began. In a similar draft range, some of the “safer floor” WRs – strong target earners with low fantasy points over expected (FPOE) – were Christian Kirk (68.7 ADP) and Diontae Johnson (74.6 ADP). Yet Pickens finished as WR39 in PPR/G, while Kirk ranked WR59 and Johnson WR78. In this case, playing it safe wouldn't have actually been safe.
Ultimately, aiming for upside offers only potential gain with no real downside. If you target positional apexes and hit, your team will be competitive. If you miss, you’re no worse off than if you had prioritized security.
HOW APEX PLAYERS AFFECTED WIN RATES IN 2024
Based on the highest-owned players on ESPN league championship rosters, the presence of the positional apexes was quite well represented. Just 35% of the players who hit the positional apex are not represented, and 70% of the list is comprised of players who did hit the apex.
|
Player |
Position |
Positional Rank
(Through W17) |
Apex? (Y/N) |
|
Jahmyr Gibbs |
RB |
RB2 |
Yes |
|
Ja’Marr Chase |
WR |
WR1 |
Yes |
|
Lamar Jackson |
QB |
QB1 |
Yes |
|
Bucky Irving |
RB |
RB15 |
No |
|
Brock Bowers |
TE |
TE1 |
Yes |
|
Trey McBride |
TE |
TE3 |
Yes |
|
Bijan Robinson |
RB |
RB3 |
Yes |
|
Amon-Ra St. Brown |
WR |
WR3 |
Yes |
|
Brian Thomas, Jr. |
WR |
WR4 |
No |
|
Malik Nabers |
WR |
WR6 |
No |
HOW TO MAKE THIS ACTIONABLE
I get that this might seem simplistic at first – like I’m just saying the key to winning fantasy football is having good players, which is clear.
But how do we actually achieve this? If you drafted Chase, you likely never had a shot at Jefferson or St. Brown in single-QB snake draft leagues, as all were taken in the first round.
While that is true in this particular example, across other positions and other years, there are plenty of players who arrive at or near the apex from down the board (i.e., Brock Bowers, Jayden Daniels). We need to familiarize ourselves with the indicators that predict league-winning upside and make them a heavy priority when it is our turn to select a player or make a decision.
But are there certain stats that correlate better with upside than they do broadly to PPR +N1?
MEASURING CEILING, NOT JUST POINTS
Most models try to predict who will score next year, but identifying apex players requires adjusting our approach. PPR +N1 Pearson correlations are useful for determining which statistics carry over from year to year, but they treat all outcomes equally. A single metric can be highly predictive of average fantasy scoring yet provide no insight into what creates upside. To uncover that, we need a method that specifically correlates to the apex.
I chose a binary system based on rank, assigning ones to the players who hit the apex – the individuals who vastly exceeded their peers, or league winners. Based on traditional patterns I’ve observed, I set an apex range of roughly three per starter: three QBs, six RBs, nine WRs, and three TEs.
That gives us just nine WRs per year; going back ten years, that’s only 90 entries. It’s a small sample, and that’s the position with the most data. At QB, I only arrive at 30. To make matters worse, many of the same players recur. Jalen Hurts is an annual statistical anomaly due to added rushing TDs from the Tush Push, essentially an Eagles-only play, so his repeated presence skews the pool. In a sample this small, this irregularity carries a great deal of weight.
In an attempt to counter these issues, I created another category called the secondary apex, which doubles the entries: six QBs, 12 RBs, 18 WRs, and six TEs. This strays somewhat from the original goal, since it includes players who didn’t quite reach the top tier, but the trade-off is a more balanced dataset and fewer distorted results, which I consider worthwhile.
I pored over hundreds of advanced statistics this spring, finding Pearson correlation coefficients for every stat I could, running my correlations to PPR + N1 to diagnose what is predictive (correlating to same-season PPR would be more descriptive). If you’ve been following my work with the Overlooked Stats series, you already knew that.
But for this apex study, I ran three correlations instead of one:
- PPR +N1: how well does this stat predict next-year PPR? This essentially serves as the control for our experiment, giving us a baseline for comparison.
- Apex: a binary flag (1/0) for the true ceiling hitters (roughly three per fantasy starter at each position).
- Secondary Apex: a larger 1/0 pool (≈2× Apex) in an attempt to reduce small-sample fragility.
Because Apex and Secondary Apex are 0/1, their correlations are point-biserial; numerically, they match Pearson against a binary target. This lets us compare them directly to the PPR +N1 correlation.
COMPARING APEXES TO PPR +N1 CORRELATIONS
For upside, level one is: Does this stat correlate with Apex? Level two, which is the real point of the study, is: Does it correlate with Apex more than with generic PPR +N1? So for each stat, we compute:
- ^ = corr(Apex) – corr(PPR +N1)
- Secondary ^ = corr(Secondary Apex) – corr(PPR +N1)
Positive deltas mean the stat adds ceiling information you don’t already get from plain fantasy scoring. Negative or flat deltas are box-score mirages; they project volume fine, but not spike weeks.
SELECTION RULES (WHAT GETS HIGHLIGHTED, AND WHICH PLAYERS QUALIFY)
To keep the lists useful, I’ve used two filters:
- Apex correlation R≥0.30 for QBs and R≥0.50 for RB, WR, and TE (applied to ^ and Secondary ^). QBs are not being downgraded, but if I keep an R≥0.50 for QBs, no stats come through, so this modification is only to give us a meaningful field.
- Apex > 0 (it improves on the PPR +N1 baseline).
These were the statistics across RotoViz, PFF, Fantasy Points, ESPN, and Next Gen Stats that hit on all criteria.
Once I settled on the criteria I wanted to spotlight, I needed a way to mark what counted as a hit. It’s a little arbitrary, but in classic fantasy fashion, I decided a top-12 finish in 2024 for each statistical category would qualify.
QUARTERBACKS
|
|
^ |
Secondary ^ |
Correl Delta |
|
Passing FPOE |
0.436 |
0.489 |
0.001 |
|
Rushing TDs |
0.324 |
0.283 |
0.094 |
|
Passing TDs |
0.286 |
0.257 |
0.032 |
|
Rushing
Atts/G |
0.335 |
0.370 |
0.007 |
|
Rushing
Avoided Tackles |
0.352 |
0.300 |
0.193 |
Immediately, we can likely confirm two things: TDs and rushing provide added upside for QBs. I would gather that the rushing element is of no surprise to anyone; we’ve been chasing upside via QB rushing for years.
We may be a bit surprised by TDs as a qualifier, because we know that TD regression is a real thing, and the QB position provides the largest sample size, so off-kilter results are especially likely to bounce back to the mean.
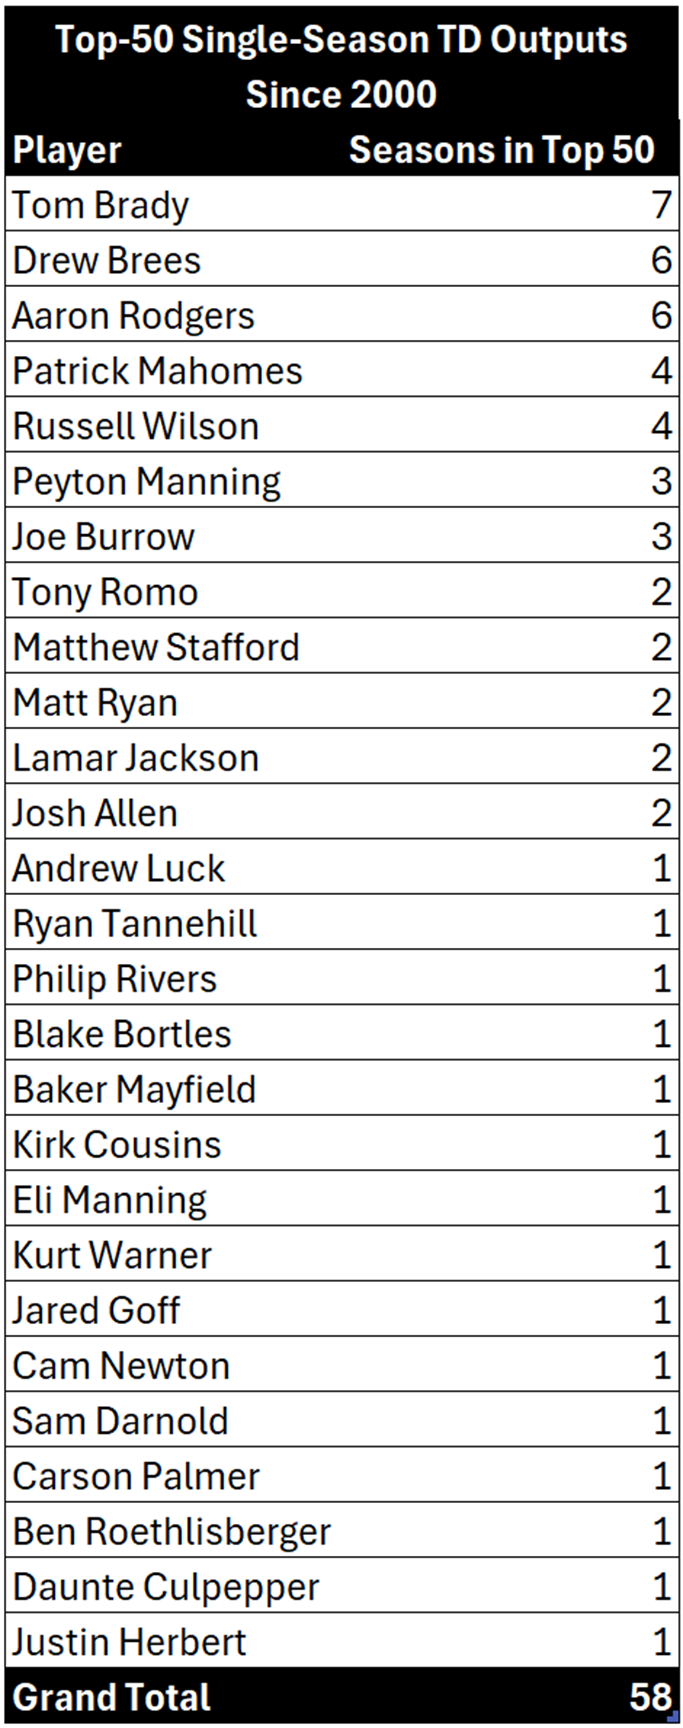
On the other hand, certain great players carry higher TD rates as baselines, so they consistently outperform the mean. Aaron Rodgers, Lamar Jackson, Peyton Manning, Patrick Mahomes, Tom Brady, and Drew Brees have the best TD rates since 2000, and while the league average hovers around 4%, these QBs regularly sit in the 5–6% range. It’s no surprise they dominate the list of Top-50 single-season TD outputs since 2000 (even though Jackson and Mahomes have only been in the league seven and eight years, and Manning retired in 2015). High TD output, in other words, tends to be sticky for QBs who have an established pattern of consistently putting up higher TD outputs.
As the saying goes, two things can be true.
I wouldn’t get too in the weeds about which stats are giving the most signal. Again, we have a sample size problem anyway, so we shouldn’t take too many of these to the bank. But another way we can push back on the small dataset is by finding players who hit in more categories than others. In a way, this introduces more data points and clarifies the picture.
- Quarterbacks Who Hit on 5/5 Criteria: Lamar Jackson, Josh Allen
- Quarterbacks Who Hit on 4/5 Criteria: Baker Mayfield, Jayden Daniels, Jalen Hurts
- Quarterbacks Who Hit on 3/5 Criteria: Bo Nix, Kyler Murray, Anthony Richardson, Justin Fields
Clearly, the Big Four are no surprise here.
Baker Mayfield is a popular regression candidate; I even highlighted him myself this spring. I think it’s safe to pull Mayfield out of that top tier, given these concerns and OC Liam Coen’s move to Jacksonville. Still, I’d view him as a higher-upside option once the position starts to flatten. He’s also the only QB on this list not tied to rushing, though he’s better at it than he gets credit for.
Fields and Richardson, meanwhile, are so good at running and so shaky as passers that the fantasy community mostly treats them for what they are. And most people actually (rightly) roster them for floor, not ceiling. To access a huge ceiling, you need passing production as well as rushing But they should land in the top 12 most weeks if they are active. As such, they aren't really my cup of tea, personally, although I'll admit it: you will likely beat ADP pretty much any time they are playing.
Richardson opens the year behind Daniel Jones, which is... a problem. There’s a real chance Jones plays well enough to keep the Colts in the playoff mix, and in that case, Richardson might never see the field.
Fields doesn’t have that same problem; his backup is a 36-year-old veteran, and it’s hard to imagine the Jets preferring Tyrod Taylor even if they start dropping games.