
Quick Slant: SNF - City of Extremes

Mat Irby’s Quick Slant
Back in 2015 or so, I worked for a time on the rigging crew for The Americans. I was brought on during prep, with a slight overlap into shooting. We were at the stages almost constantly, hanging pipes to extend the grid, setting points for lights, making snoots out of corrugated plastic to hug lamps tightly and focus them, or putting diffusion on windows. So, more than most jobs I’ve had in showbiz, it operated for a month or so like a nine-to-five.
The stages were, as I remember, three or four converted warehouses or commercial spaces in Gowanus, between Park Slope and, say, Carroll Gardens. One was on Nevins, about a 20-minute walk from the Atlantic Avenue subway hub, a major connector that could get me home. Often I’d get off work around 6 PM and head that way, right past the futuristic façade of Barclays Center, whose ungeometric red halo, shaped a bit like a thick painter’s palette – or maybe a droopy bagel – always caught my eye.
Even then, much of the area was developed or being developed; you could feel the neighborhood shift from red brick to glass with each step east, the lush trees growing more prominent and the graffiti less so. Williamsburg, once blue-collar, had already passed through its hipster phase and given way to swanky steel duds for Wall Street Bros who, from apartments high enough, could no doubt look northwest and see the Brooklyn Bridge. This redevelopment was charging south and east, so I’m sure Flatbush and Bed-Stuy have since been conquered as well. In 2015, Prospect Heights and Gowanus were a juxtaposition of longtime working-class lifers with rent control and jobs requiring hard hats or teaching certificates, and the inevitable invasion of “progress.”
Nothing epitomized it better to me than the area around Barclays Center. Down some streets, boutiques and hip dessert spots had already appeared. Down most, though, regular folks went about their lives under old roofs, driving regular cars to union jobs. Kids skipped rope, and bodega cashiers took smoke breaks on street corners; they just happened to live in the shadow of this modern venue, lifeless for 20 hours a day.
But at night, their neighborhood was borrowed by 20,000 trespassers who came to see Ariana Grande or the Brook Lopez-led Nets host the Trailblazers. They entered without credentials, overwhelmed the streets with impunity, and slowed traffic by crossing sidewalks while distracted by their GPS. Locals had accepted this arrangement, but did so with breathless sighs and deep eye rolls as they passed another handful of young women with a phone on the end of a selfie stick. Barclays Center was just another building in a normal neighborhood 95% of the time, but almost nightly, it turned the neighborhood into this whole other thing.
South of the Border, Santa Úrsula Coapa isn’t the leafy-green, café-lined Mexico City of Roma or Condesa that tourists might know – all fresh paint and gold accents, like Vienna crossbred with the Hanging Gardens. Santa Úrsula, like Gowanus in 2015, is where regular folks live in the shadow of a famous stadium, Estadio Banorte (formerly Estadio Azteca), where Pelé won his third World Cup and Maradona scored two of the most famous goals ever in four minutes – where Michael Jackson played five straight sold-out shows, and Julio César Chávez TKO-ed Greg Haugen in front of 132,000 people.
Like New York, Mexico City is a city of extremes. It sits 7,300 feet above sea level, over 2,000 feet higher than Denver. Its metropolitan area has 22 million residents; once the world’s largest, it remains the biggest in North America. As high as it is, it’s surrounded by even taller mountains, some exceeding 17,000 feet. Founded in 1325, roughly three centuries before Boston or Santa Fe, it is one of the oldest continuously inhabited major cities in the Americas. Even its climate, from day to night or rainy season to dry, is steeped in extremes.
It is only fitting, then, that Mexico City will host San Francisco and Minnesota on Sunday, the NFL’s most extreme offense and most extreme defense. A nearly 70% blitz rate against over 12 yards per attempt against the blitz.
There’s an old saying in boxing that styles make fights. On Sunday, the question is whether San Francisco can make Minnesota defend the whole field, or whether Minnesota can make San Francisco look small. Either way, for a few hours, the people of Santa Úrsula will have another 80,000 or so neighbors – selfie sticks, street vendors, and overfilled sidewalks – and a guy dashing through it all who just wants to get home.
GAME ENVIRONMENT
Minnesota Vikings at San Francisco 49ers (-3)
Over/Under: 46.5
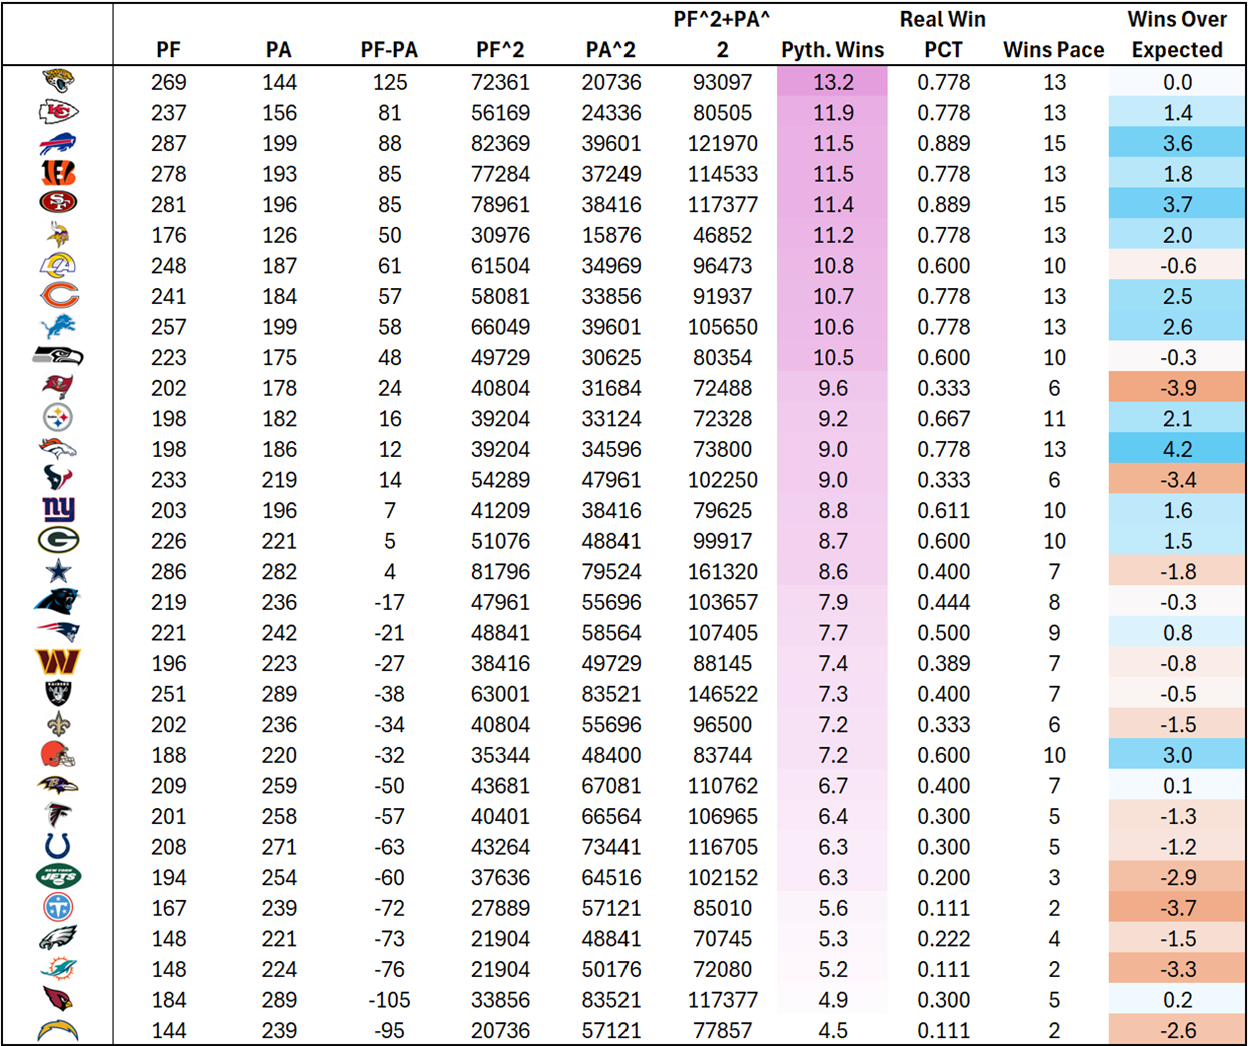
Minnesota (7–2) and San Francisco (8–1) meet at Estadio Banorte in Mexico City, with the 49ers designated as the home team. Both teams are pacing for 15 wins. San Francisco ranks fifth in Pythagorean Wins (pacing for 11.4), exceeding its expected win pace by 3.7 games. Minnesota ranks sixth (pacing 11.2), outperforming expectation by 2.0 wins. Of course, it should be remembered that nobody ever paces for 15 Pythagorean Wins, and these are the fourth- and fifth-best Pythagorean Wins trajectories in the league.
The markets favor San Francisco, which has the second-best Super Bowl odds according to FanDuel Sportsbook (+550), while Minnesota’s odds are at +1500 (9th). Either way you slice it, these are likely two of the better teams in the NFC.
Adding to the intrigue, the Vikings recently acquired QB Kirk Cousins, who has enjoyed some of his best seasons in variations of the Shanahan system, beginning in Washington under Kyle Shanahan and later Sean McVay, then in Minnesota under Kevin Stefanski, Gary Kubiak, Klint Kubiak, and Kevin O’Connell, and earlier this season in Las Vegas under Klint Kubiak again. Now, he’s reunited with O’Connell, under whom he was playing at an MVP-caliber pace in 2023 before tearing his Achilles.
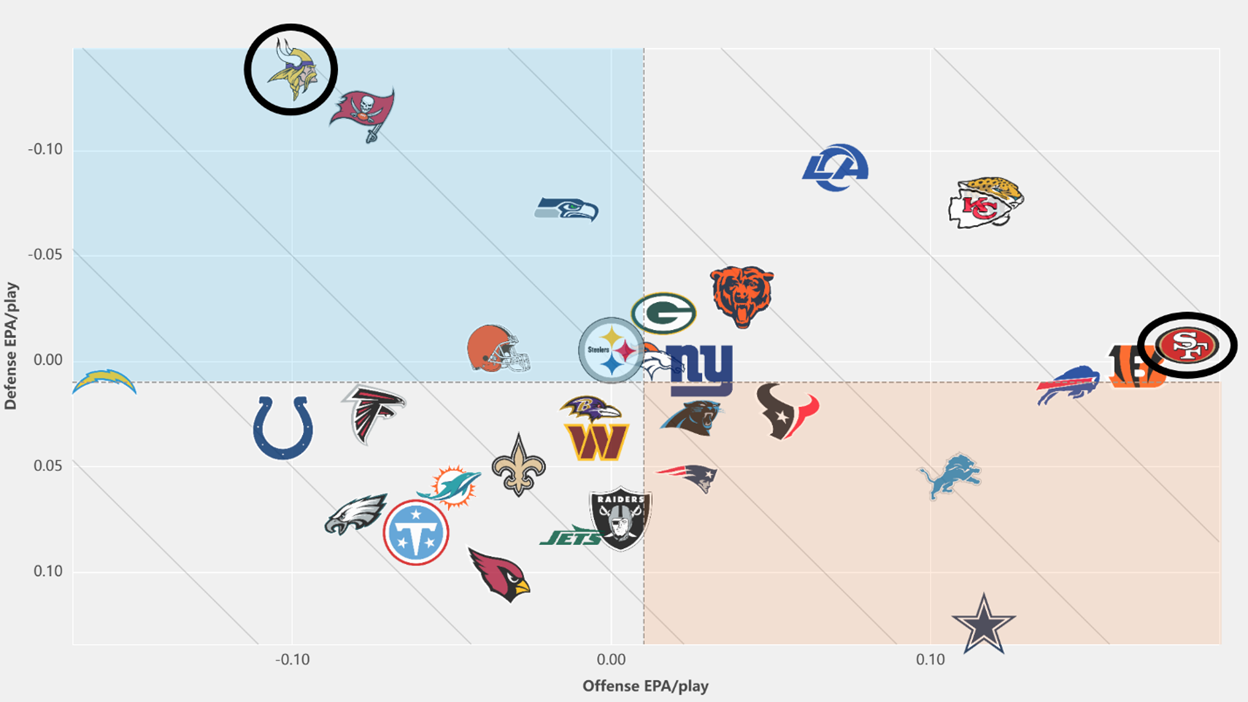
The 49ers lead the NFL in offensive EPA per play (0.180), while the Vikings rank 30ᵗʰ (-0.100). Defensively, however, Minnesota leads the league in EPA per play allowed (-0.138), compared to San Francisco's -0.008 (9ᵗʰ). The contrast between San Francisco's offense and Minnesota's defense is particularly pronounced, with both units ranking first in their respective categories.
The hope for Minnesota, of course, is that Cousins can revive an offense that has largely stalled under QBs Kyler Murray, Carson Wentz, and Max Brosmer. There was some encouragement in his first start in Week 10, when Minnesota ranked 12ᵗʰ in EPA per play, a considerable improvement over its 31ˢᵗ-ranked performance from Weeks 1–9.
Neither team plays especially quickly. San Francisco averages 29.4 seconds per snap (23ʳᵈ) in neutral script, compared to Minnesota's 30.2 (30ᵗʰ). Across all game scripts, the 49ers average 61 plays per 60 minutes (18ᵗʰ), while the Vikings average 58 (29ᵗʰ). The relatively slow pace limits the overall play-volume outlook, despite a betting total of 46.5.
The game will be played at approximately 7,350 feet above sea level. San Francisco has spent the week training in Colorado Springs to acclimate, while Minnesota has remained at its home facility, using simulated-altitude training.
Weather: Sunday evening in Mexico City should be partly cloudy, with temperatures around 67° at kickoff, falling into the low 60s later in the game. The current forecast calls for afternoon rain but only a 12% chance of precipitation during the game.
Minnesota Key Injuries: WR Jordan Addison (thumb) and QB Kyler Murray (hamstring) are out. S Jay Ward (knee) and CB Isaiah Rodgers (quad) are questionable. TE T.J. Hockenson (wrist), WR Jauan Jennings (calf), OLBs Andrew Van Ginkel (quad) and Kyle Van Noy (calf), and LB Blake Cashman (concussion) practiced fully on Friday and carry no game designations.
San Francisco Key Injuries: WR Mike Evans (Achilles), LBs Dre Greenlaw (neck) and Luke Gifford (chest), CBs Upton Stout (shoulder/neck) and Nate Hobbs (adductor), QB Mac Jones (illness), and RB Jordan James (calf) are all listed as questionable. CB Renardo Green (back) and S Ji'Ayir Brown (ankle) practiced fully on Friday and carry no game designations. RB Christian McCaffrey and LT Trent Williams returned to full participation after Wednesday's rest day. No 49ers were ruled out.
VIKINGS
Implied Team Total: 21.75
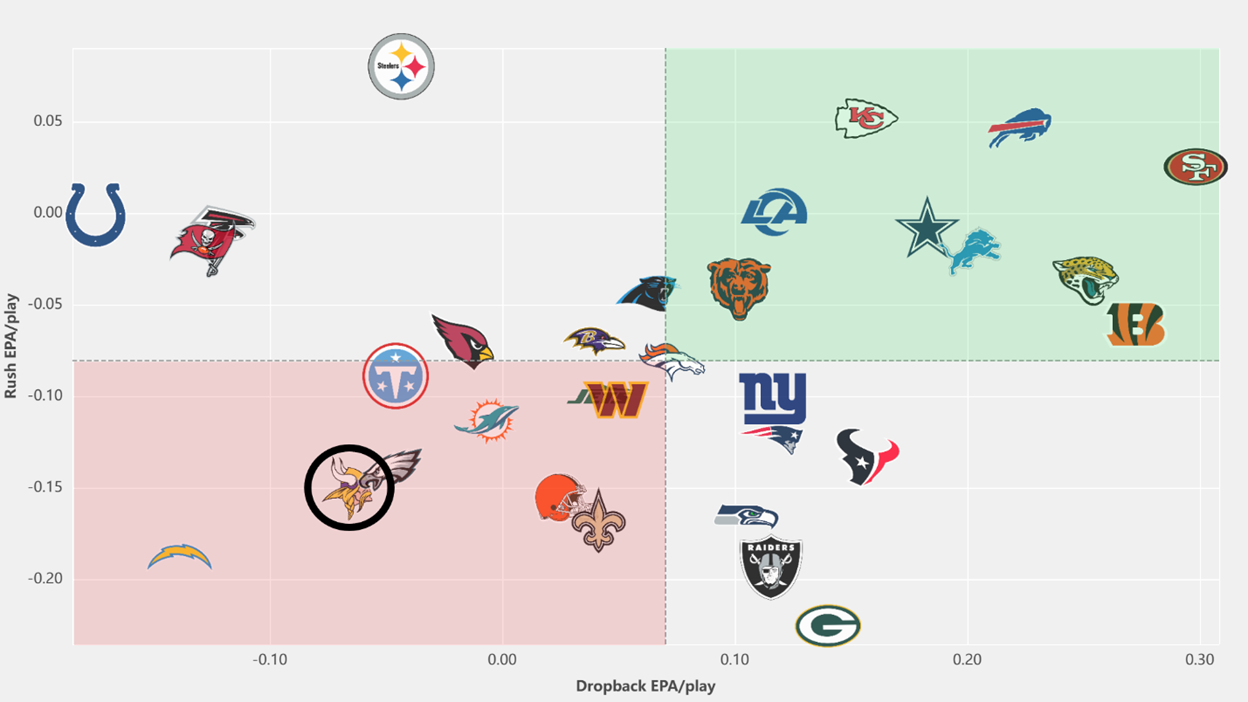
Minnesota ranks 30ᵗʰ in offensive EPA per play (-0.100), including -0.067 EPA per dropback (28ᵗʰ) and -0.150 EPA per rush (26ᵗʰ).
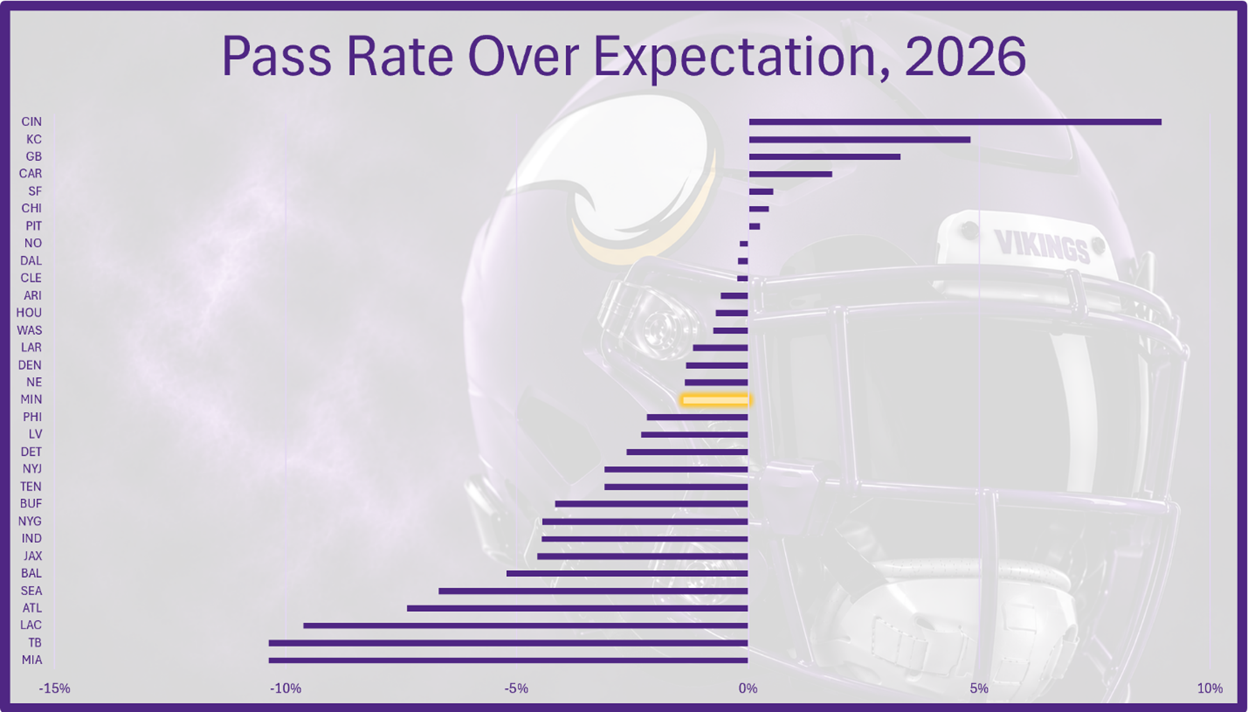
The Vikings have been slightly more run-oriented than expected, ranking 17ᵗʰ in PROE (-1.40%).
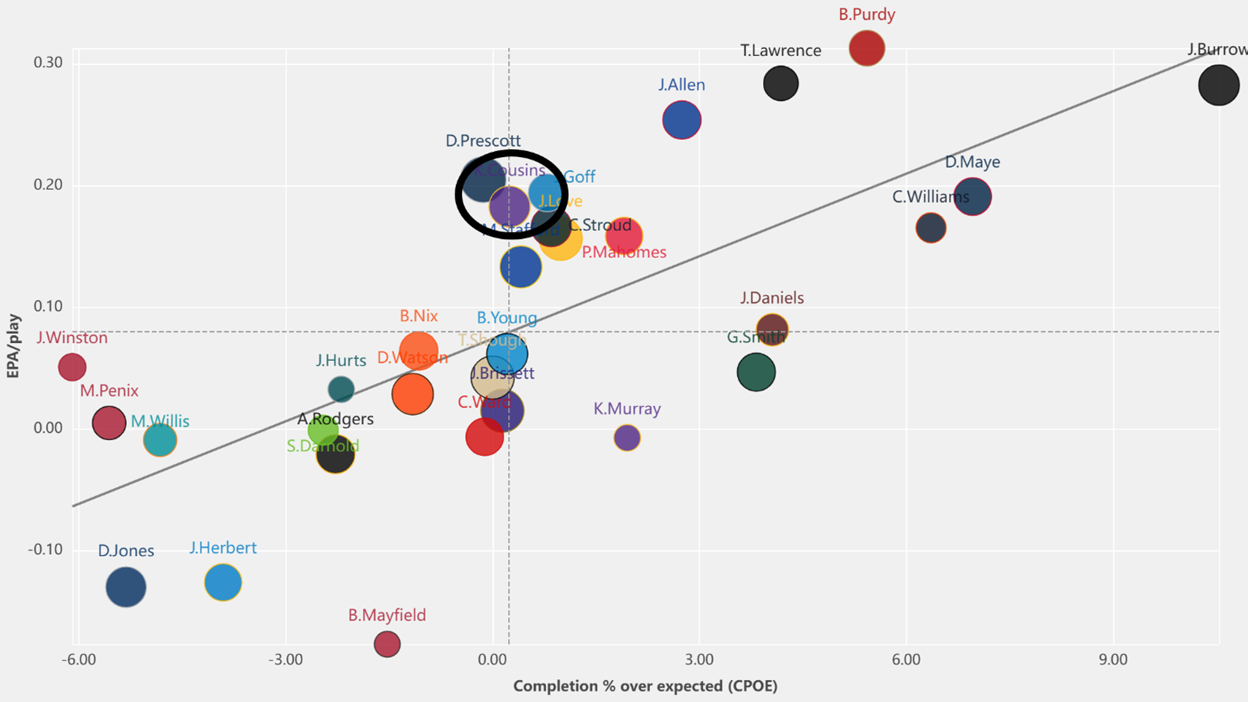
QB Kirk Cousins has averaged 36.7 dropbacks/G (14ᵗʰ) and 34.6 passing attempts/G (10ᵗʰ) across 10 games with Las Vegas and Minnesota. He has produced 0.183 EPA per dropback with a 0.25% CPOE, averaging just 1.38 rushing FP/G (23ʳᵈ).
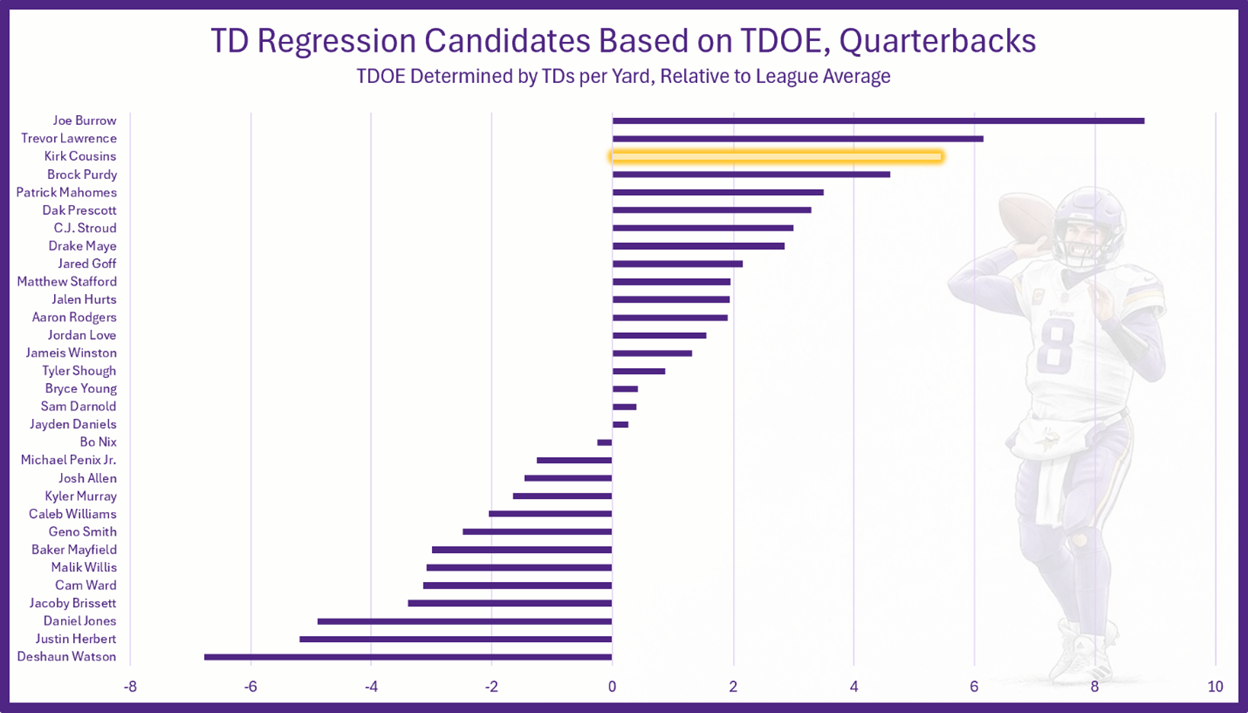
Cousins has thrown for 2,547 YDs, 22 TDs, and nine INTs. His 6.4% passing TD rate ranks T-5ᵗʰ, while his 2.2 passing TDs/G rank fourth. However, he has also thrown 5.4 more TDs than expected based on his passing yardage, the third-largest positive TDOE in the league. This could spell incoming negative TD regression, although QBs in Shanahan schemes are prone to efficiency.
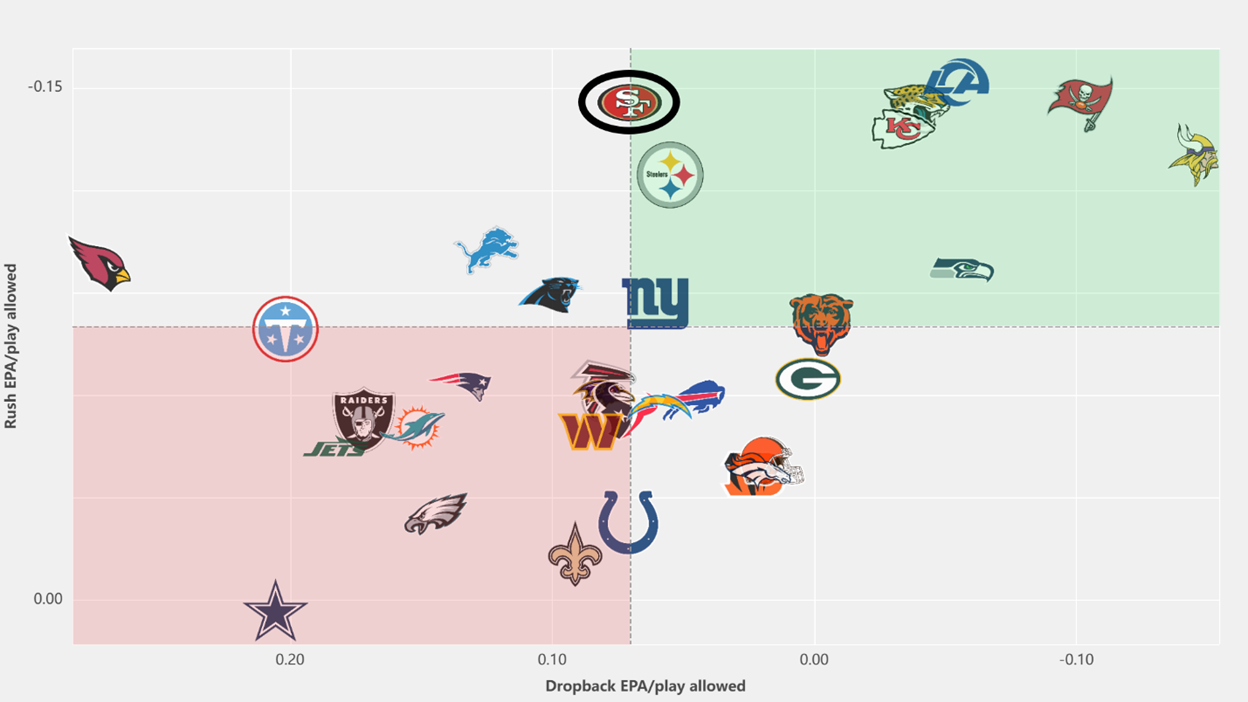
San Francisco ranks ninth in defensive EPA per play allowed (-0.008), although the 49ers have been considerably better against the run than the pass. They allow -0.146 EPA per rush (2ⁿᵈ), compared to 0.070 EPA per dropback (16ᵗʰ).
San Francisco primarily plays zone coverage (81.0%, 7ᵗʰ), using man on just 14.8% of defensive plays (26ᵗʰ). The 49ers use single-high safeties 58.7% of the time (6ᵗʰ), compared to 41.3% two-high (27ᵗʰ). Their most common coverage is Cover 3 (43.6%, 4ᵗʰ). They blitz on 29% of dropbacks (16ᵗʰ).
Cousins is not yet included in Fantasy Points' Coverage Matchup tool, having played just one game for Minnesota. The PFF Matchup tool grades his assignment as poor.
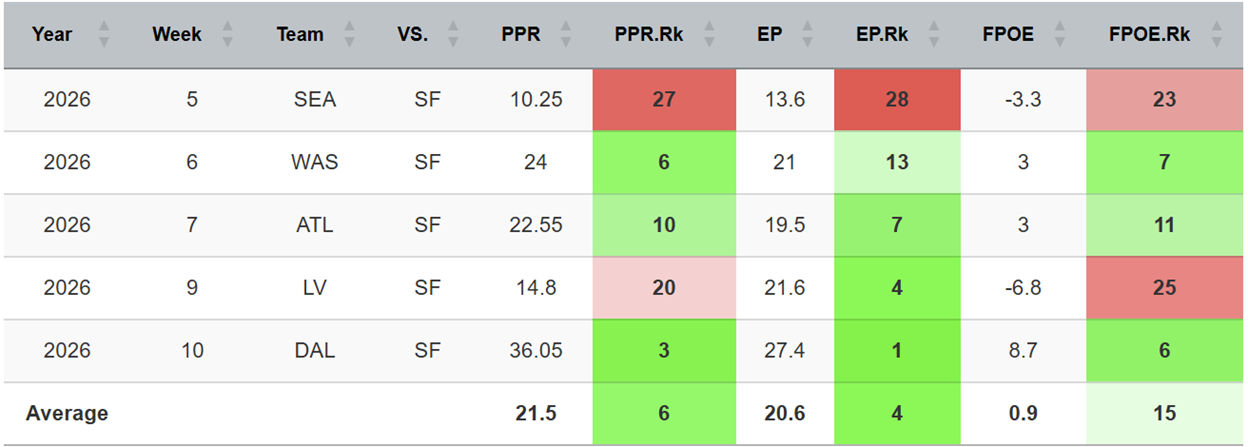
Over their last five games, the 49ers have allowed 21.5 FP/G to QBs (6ᵗʰ), including 20.6 EP/G (4ᵗʰ) and 0.9 FPOE/G (15ᵗʰ). Most recently, QB Dak Prescott scored 36.05 FP against San Francisco in Week 10, exceeding his 27.4 EP by 8.7 FP.
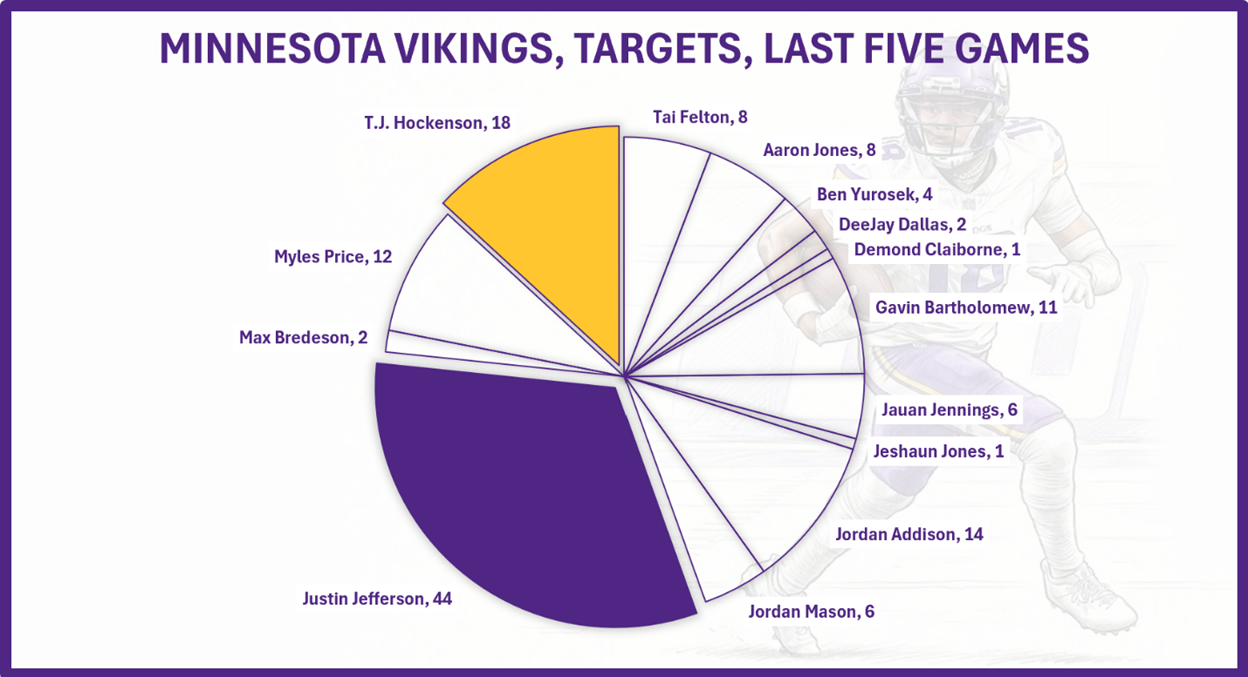
With WR Jordan Addison sidelined following thumb surgery, Minnesota will continue to rely heavily on WR Justin Jefferson. WR Jauan Jennings has missed the last two games with a calf injury but returned to practice this week and is expected to be available against his former team.
Over their last five games, Jefferson has led Minnesota with 44 targets, followed by TE T.J. Hockenson (18). No other Vikings pass-catcher has 15 or more targets.
Jefferson has a 26.18% target share (T-10ᵗʰ), averaging 7.62 targets/G (18ᵗʰ) and 2.06 YPRR (23ʳᵈ). His 36% first-read target share ranks seventh, while his 29% TPRR ranks T-7ᵗʰ. He has averaged 13.5 EP/G (15ᵗʰ), with 0.19 FPOE/G (40ᵗʰ).
During his first three seasons with QB Kirk Cousins, Jefferson finished ninth (17.1), fourth (19.4), and second (21.7) among WRs in PPR/G from 2020–2022. He averaged 20.2 PPR/G in 2023, although Cousins missed the second half of that season. Jefferson is averaging 13.9 PPR/G in 2026.
According to Fantasy Points' Coverage Matchup tool, Jefferson is projected for a 9.2% upgrade against San Francisco's defensive coverage. The PFF Matchup tool grades his assignment as good.
Jennings has played a limited role through six games, averaging 1.67 targets/G with 66.3% route participation and 0.34 YPRR. His 7% TPRR reflects limited involvement when running routes, although Addison's absence could create additional opportunities. Fantasy Points projects Jennings for a 19.9% downgrade against San Francisco's coverage, while PFF grades his matchup as poor.
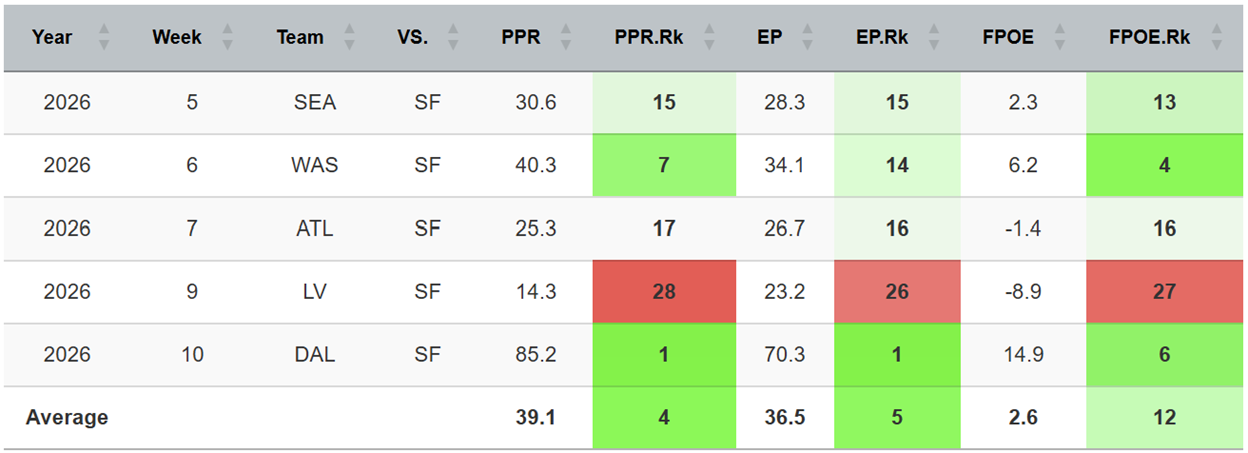
Over their last five games, the 49ers have allowed 39.1 PPR/G to WRs (4ᵗʰ), including 36.5 EP/G (5ᵗʰ) and 2.6 FPOE/G (12ᵗʰ).
TE T.J. Hockenson has averaged 5.38 targets/G (10ᵗʰ), with an 18.45% target share (T-8ᵗʰ) and 61.3% route participation (T-19ᵗʰ). His 26% TPRR ranks fifth, while his 2.01 YPRR ranks seventh. Hockenson also ranks seventh in first-read target share (20.3%) and second in receiving 1Ds per route (11.7%). His provisional Apex Score is 6.850 (T-11ᵗʰ among TEs).
Hockenson missed Week 10 with wrist and chest injuries but returned to limited practice Wednesday.
Fantasy Points' Coverage Matchup tool projects Hockenson for a 2.2% downgrade against San Francisco's coverage. The PFF Matchup tool grades his assignment as fair.
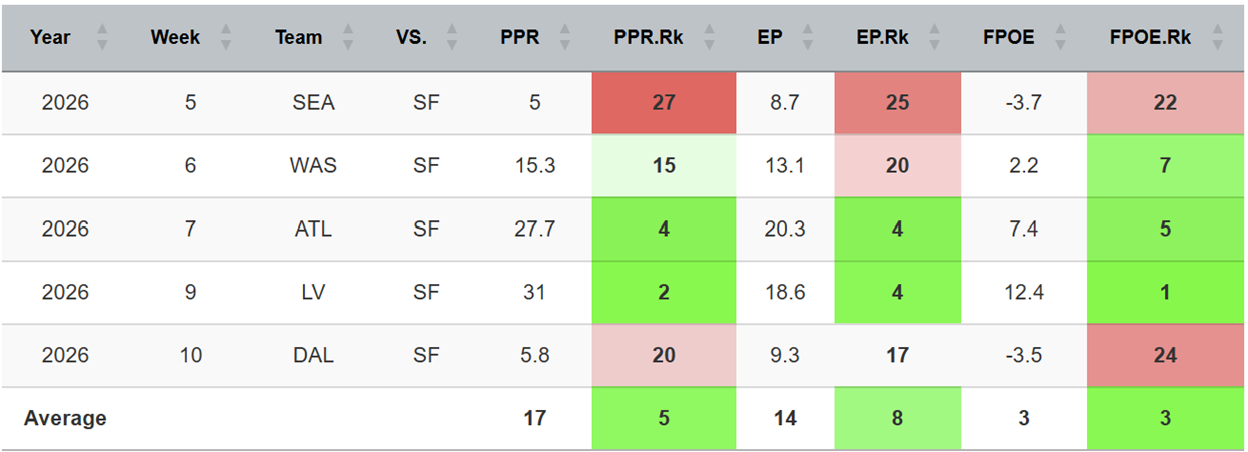
Over their last five games, San Francisco has allowed 17.0 PPR/G to TEs (5ᵗʰ), including 14.0 EP/G (8ᵗʰ) and 3.0 FPOE/G (3ʳᵈ).
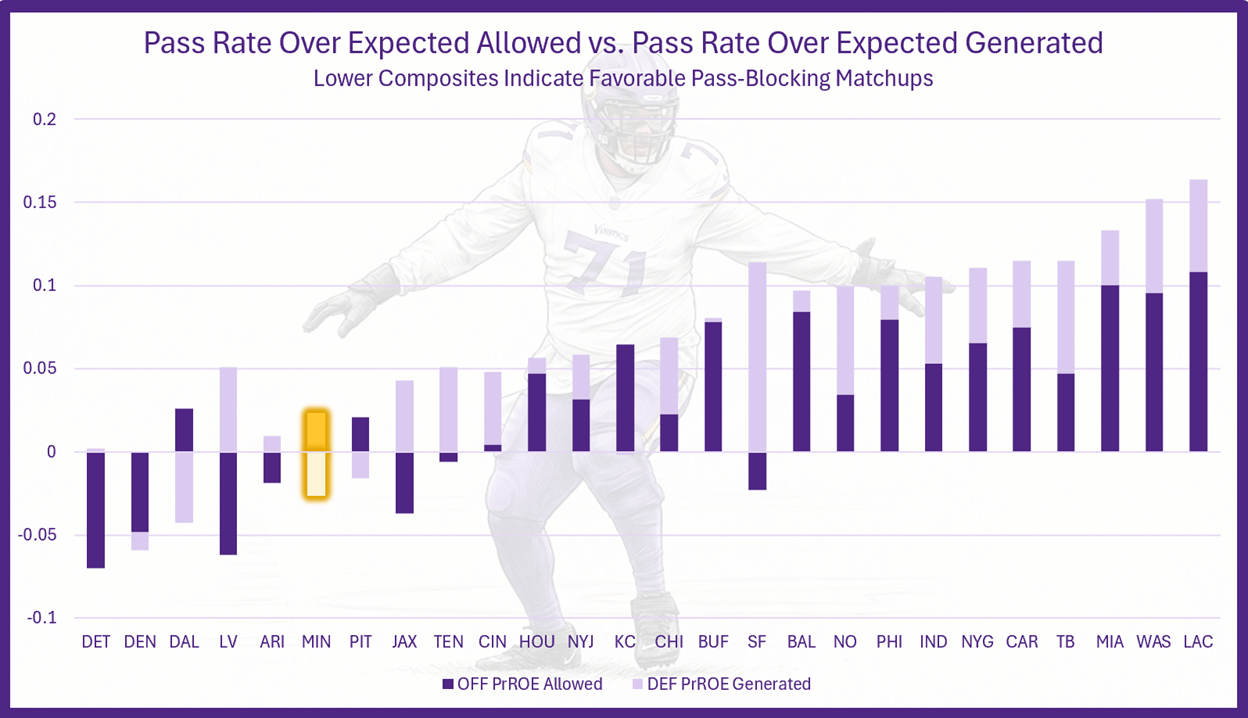
Minnesota has a favorable pass-blocking matchup based on PrROE allowed versus San Francisco's PrROE generated. The Vikings have allowed a 2.34% PrROE, while the 49ers have generated -2.65%, producing a composite of -0.31%, the sixth-lowest among the 26 teams in this week's data.
The run-blocking matchup is less distinctive. Minnesota has generated 2.09 adjusted YBC/Att, while San Francisco has allowed 1.81. The composite ranks 16ᵗʰ among the 26 teams on this week’s slate.
Minnesota has operated a committee between RB Jordan Mason and RB Aaron Jones, although Mason's extended absence allowed Jones to operate as the feature back for several weeks. Mason has averaged 12 carries/G (29ᵗʰ) and 6.44 rushing EP/G (35ᵗʰ), compared to Jones' 14 carries/G (T-18ᵗʰ) and 7.56 rushing EP/G (24ᵗʰ). However, since returning from a thumb injury in Week 7, Mason has outcarried Jones in all four games, including 16–11 in Week 10.
Jones has played 58% of Minnesota's offensive snaps (21ˢᵗ), with 38.7% route participation (22ⁿᵈ). He averages 2.44 targets/G (T-25ᵗʰ) and 3.03 receiving FP/G (T-34ᵗʰ). Mason has played 48% of snaps (29ᵗʰ), with 26.5% route participation (43ʳᵈ), averaging 1.2 targets/G (46ᵗʰ) and 0.54 receiving FP/G (49ᵗʰ).
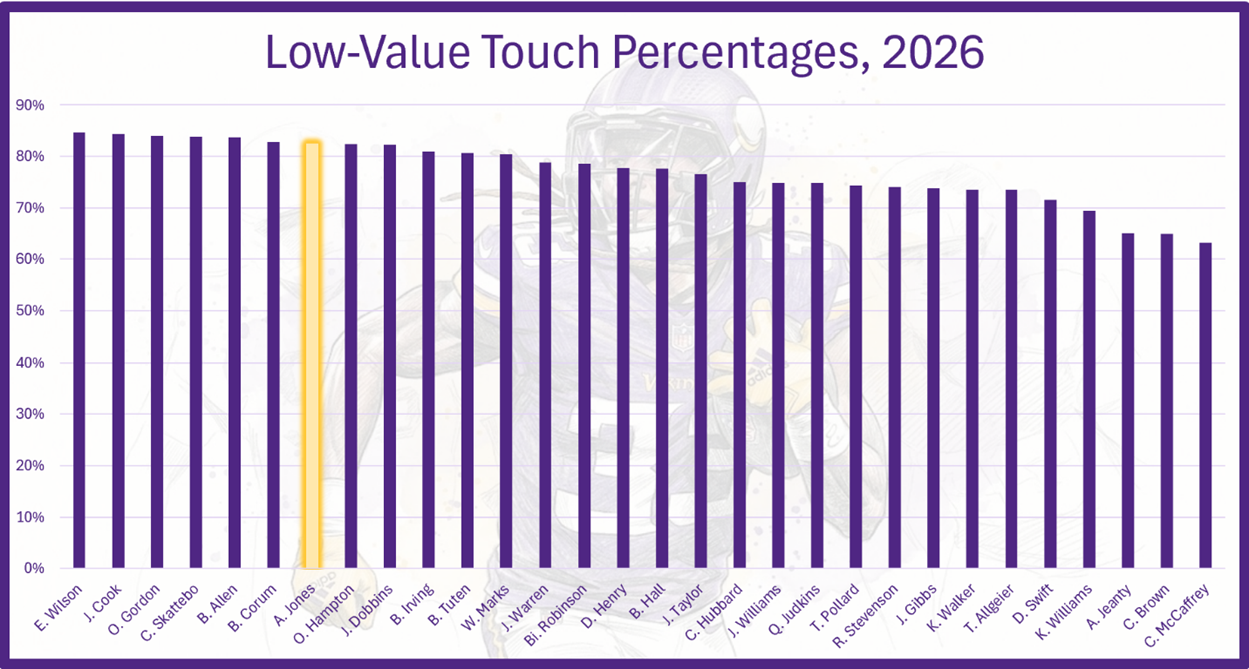
Neither back has been particularly efficient relative to rushing opportunity. Jones has averaged 0.02 rushing FPOEPA (T-24ᵗʰ), compared to Mason's -0.03 (T-35ᵗʰ). 82.5% of Jones’ touches have been LVTs, the seventh-highest rate among qualified RBs. Mason has recorded just five HVTs, with 91.9% of his touches classified as LVTs.
The PFF Matchup tool grades Mason's rushing assignment against San Francisco as fair, while Jones receives a poor grade. As receivers, Jones draws a fair matchup, compared to poor for Mason.
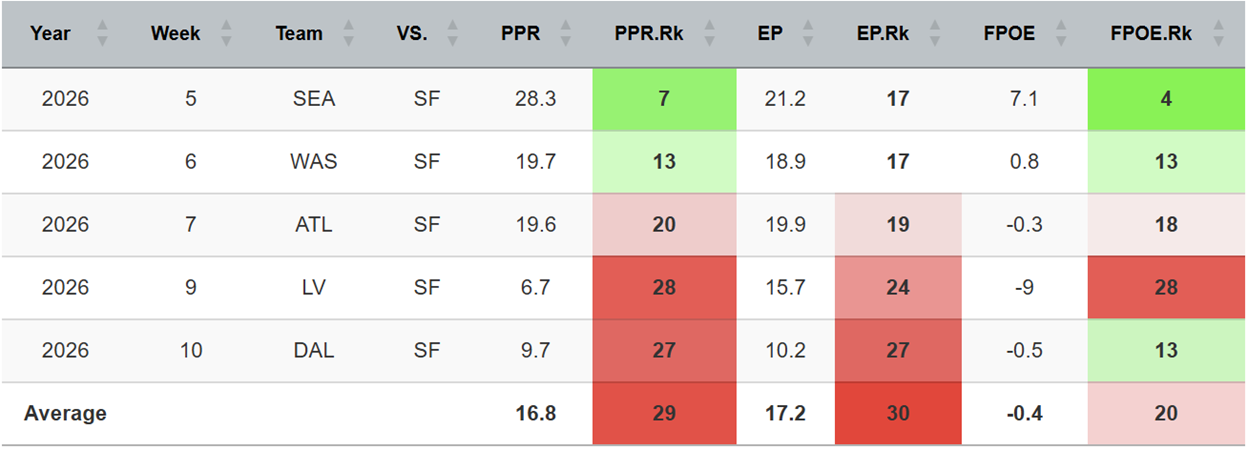
Over their last five games, the 49ers have allowed just 16.8 PPR/G to RBs (29ᵗʰ), including 17.2 EP/G (30ᵗʰ) and -0.4 FPOE/G (20ᵗʰ). The limited expected opportunity has been the larger obstacle, rather than unusually poor efficiency from opposing backs.
San Francisco has allowed 5.0 RB receptions/G (8ᵗʰ) over that stretch, but only 26.8 receiving YDs/G (21ˢᵗ) and 0.2 receiving TDs/G. Opposing RBs have averaged 5.6 targets/G. That receiving volume offers Jones a modicum of PPR opportunity, although the 49ers have generally limited the yardage produced from those receptions.