Mat Irby's Apex Score: Quarterbacks

In the last two weeks, I’ve written damn near 15,000 words about WRs and RBs, going round-by-round to compare Apex Scores to ADP in search of market inefficiencies. This time, I’m doing things differently.
- Introducing Apex Score: Quantifying Upside and Beating Redraft ADP at Running Back
- Mat Irby's Apex Score: Wide Receiver
WHAT IS APEX SCORE?
The greatest advantage in fantasy football is found at the top of each position group in fantasy points per game (FP/G). That’s where the gaps between players become disproportionately large. The difference between QB1 and QB2, for instance, is generally more meaningful than the difference between QB10 and QB11. Eventually, the distribution flattens enough that moving up one spot provides little advantage.
I call that extreme upper end of the distribution the positional apex.
There are different ways to define it, but I’ve found that roughly three players per fantasy starter works well for this. In a basic league starting one QB, two RBs, three WRs, and one TE, that gives us positional apexes of 3-6-9-3.
This spring, I decided I didn’t want to stop at correlating statistics to next-season fantasy points (N+1), as many have done. I wanted to know which statistics actually pointed toward those apex seasons.
That creates a problem: tiny samples.
Three QBs per season gives us only 15 apex seasons across five years. Going further back adds observations, but eventually we’re studying an NFL that doesn’t resemble this one. I mean, what does Peyton Manning’s statistical environment from 2007 tell us about 2026?
Then, especially as the sample gets smaller, repeat performers can overwhelm the results. Josh Allen alone accounts for five of the 15 QB apex seasons from the last five seasons. A statistic masquerading as one that identifies elite fantasy QBs may simply identify Josh Allen.
So I worked very, very … (weary sigh) … very hard to make these small samples more useful. I’ve certainly never worked this hard on a fantasy article series, and I’m committing today, before God and man, never to do so again.
Instead of asking one statistical question, I attacked the problem from multiple directions; think of it as popping in a few extra screws for stability. I tested which stats appeared disproportionately among apex players, but also reversed the process: when a player was elite in a particular statistic, how often did he subsequently reach the apex? Remarkably, those are meaningfully different questions.
I also doubled the usable apex pool with a secondary threshold, tested combinations of statistics, measured how consistently those combinations appeared among apex players, and checked whether one freakishly good player was driving the result. Finally, I tested whether two promising statistics provided different information or were essentially telling the same story.
None of this magically eliminates the small-sample problem. It does give us considerably more evidence than simply asking which statistic correlates best with 15 ones and zeroes.
Anyway, I don’t want to get too in the weeds; I already did that in the first article of the series, about RBs, over a 3,000-word exposition. If you’d like to read that one, or Part 2, about WRs, that would be amazing, and it may help you get a fuller picture.
TIGHT ENDS AND QUARTERBACKS
I’m doing TEs and QBs differently, for a few reasons. First, I don’t think Apex Score will be quite as useful at these positions. Why? Fewer data points (fewer screws).
There’s also less opportunity for market inefficiencies in a round-by-round format. Five or six WRs might go in a single round; some rounds won’t feature a single TE. The format of the last two articles just doesn’t work as well for onesie positions.
Instead, I’ll give you five QBs that Apex Score likes compared to the market and five that it doesn’t. That’s it. Ten names. Next time, I’ll do the same with TEs. If nothing else, it should make for a more economical, digestible read than the 8,000-word tomes I’ve been putting out lately.
With that understood, let’s hop into QBs.
THE PROCESS FOR QUARTERBACKS WAS PARTICULARLY CHALLENGING
QBs were the hardest position to model, and it wasn’t particularly close. Like, I think I lost years off my life.
The data started off screaming that rushing mattered (duh, we all know that), and seemed to want rushing inputs to represent 50-60 percent of the model. But when I was originally playing around with four or five inputs, that seemed silly. I was literally double- or triple-counting rushing production.
So, I rebelled. I explored models using two rushing inputs and got results rich with Matthew Stafford and Jared Goff, while Josh Allen was nowhere to be found. Oh, there he is at 14th.
Well, that wouldn’t do. I tinkered. Oh, Josh Allen is up to ninth now? Greeeeeaaaaat.
Then I thought of my bunny analogy about QB rushing. If rushing is like starting from an elevated platform, maybe the proper analog is to start with a higher percentage of the pie dedicated to rushing. So, I went back.
I took rushing “platform” quite literally at first, dumping rushing-only FP/G into the model and weighting it to 60%. That sort of sucked, so I started varying the rushing inputs that made up that 60%, and it started to work. Josh Allen is in the top four; I can live with that.
But hold on; Marcus Mariota is first??? And Anthony Richardson, Justin Fields, and Tyler Huntley are all in the top 20? That seems problematic for my product's credibility.
I started trying to force stats Allen was specifically good at to bump him up the board. That began to feel anything but scientific. I thought of the forensic pathologist from The Staircase in the lab, doing anything he could think of to make that blowpoke from the fireplace generate the spatter patterns at the crime scene. I realized my error and backed off.
So, there was only one thing left to do: spend an unreasonable amount of time trying combinations that thread a needle, if such a combination even existed. Rushing had to provide the platform without becoming the entire model (we need more screws). It needed to reinforce the natural tendency of raw apex correlation that rushing is by far the most important thing, yet still provide a legitimate path for Stafford, Joe Burrow, or Dak Prescott to break through once in a while (and keep Fields and Mariota from seeming like the only QBs that matter).
I tested rushing volume, rushing production, EPA, CPOE, air yards, TDs, aDOT, PFF grades, efficiency composites, interaction terms, and even separate paths for runners and pocket passers. Some models predicted the apex beautifully and produced absurd leaderboards; others made sensible leaderboards and predicted nothing. I started to wonder if it would even happen for QB Apex Score.
But finally, I found a balance that worked: a leaderboard that looked sane and enough independent stats that weren’t simply carried by imposing figures like Allen.
I’ll level with you. This one was a pain in the ass, but I’m pretty happy with where it finally landed. QB Apex Score correlated better with Apex N+1 than nearly any individual metric I tested and almost as well with PPR N+1, while maintaining decent YoY stability. I landed on a six-input model, and the three rushing stats that at least shade different sides of the sphere.
Rushing FP/G was the only metric tested that beat it in Apex N+1 correlation. Now, to be clear, I normally don’t include primary stats – stats that go directly into FP calculations – or previous-year fantasy points. Why? Because of course they correlate well with FP, and every novice drafter with a fantasy magazine printed back in June already has them. If we stop at the same information the market has, we don’t get much of an edge, do we? Advanced stats look deeper and, if handled responsibly, should be used in conjunction with primary stats and the previous year’s FP.
I made a conscious exception for rushing FP/G because I wanted one number to quantify a QB’s entire rushing contribution without simply using his overall fantasy production. Maybe that was too generous. Rushing is already the skeleton key to fantasy quarterback upside, so it’s hardly surprising that rushing FP/G narrowly beat Apex Score in Apex N+1, .379 to .363.
|
Metric |
Apex N+1 |
Capture |
YoY |
PPR N+1 |
|
Rush FP/G |
.379 |
.625 |
.844 |
.324 |
|
QB Apex Score |
.363 |
.781 |
.667 |
.440 |
|
XFP/G |
.347 |
.719 |
.867 |
.294 |
|
Rushing Yards/G |
.326 |
.688 |
.853 |
.290 |
|
Success Rate |
.287 |
.906 |
.466 |
.339 |
|
Prior-Year PPR |
.265 |
.719 |
.439 |
.439 |
|
Positive EPA % |
.239 |
.906 |
.486 |
.307 |
|
FPOE/G |
.231 |
.781 |
.319 |
.366 |
|
EPA/Play |
.226 |
.781 |
.424 |
.375 |
|
EPA + CPOE |
.220 |
.781 |
.427 |
.359 |
|
Passing TD/G |
.120 |
.531 |
.457 |
.276 |
|
CPOE |
.116 |
.844 |
.344 |
.254 |
|
Passer Rating |
.087 |
.844 |
.367 |
.290 |
|
Yards/Attempt |
.063 |
.719 |
.340 |
.237 |
But that also reinforces the point. If rushing were the only path to the apex, we could stop there. But it isn’t. Stafford can get to the apex. Burrow can get there. Apex Score’s job isn’t to beat rushing at being rushing; it’s to retain as much of that enormous signal as possible while identifying the other paths to the apex that rushing alone can’t see.
FP/G correlates best to Apex N+1. That means we start from the stat and ask: how well does this point to the players that hit apex the following season? FP/G produces a decent leaderboard, though we do see Justin Fields and J.J. McCarthy in the top ten (there are often strange glitches like that when we correlate a single stat, so that’s not that alarming).
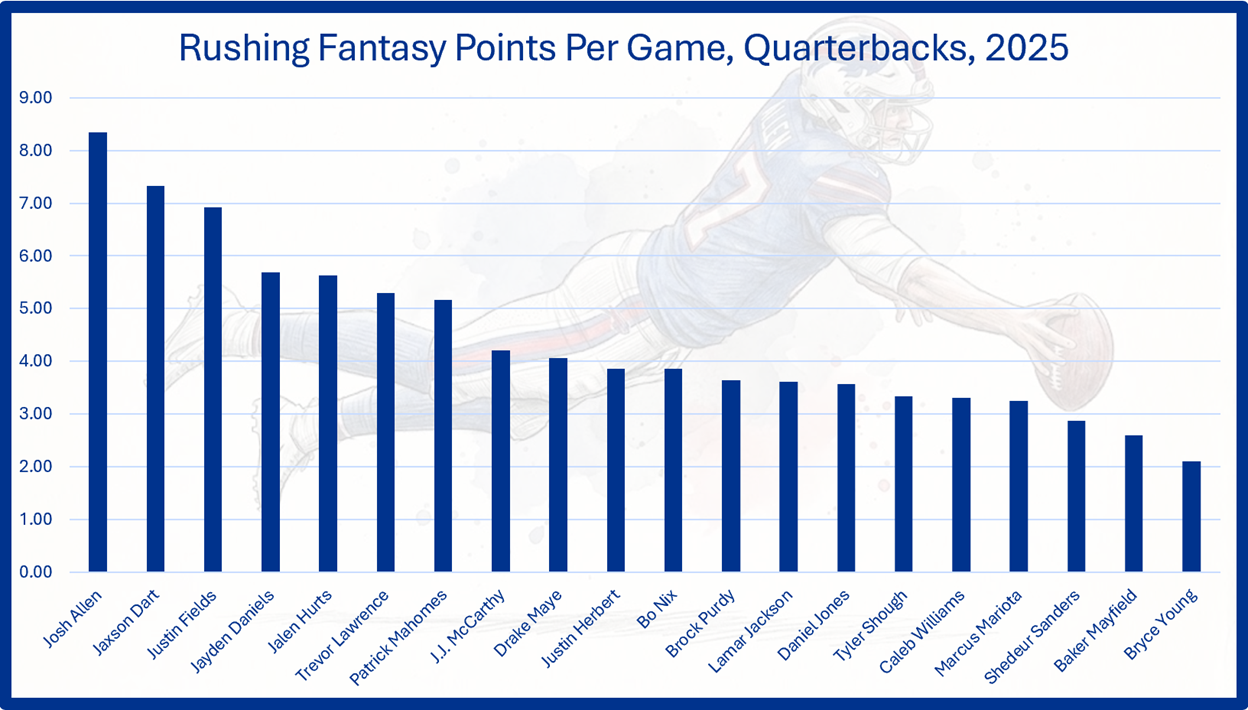
Rushing FP/G is also more stable than Apex Score, as are a couple of other stats: Fantasy Points’ expected fantasy points (XFP) per game and rushing yards per game. All told, rushing FP/G is possibly the very best way to look forward at QB.
But I also used what I call Apex Capture. Apex Capture asks the question the other way around. We start with players who finished at the apex and look back, asking: which stats do players at the apex repeat most? When we do it that way, the Apex Score looks best.
More importantly, across a 2021-2025 sample, Apex Score’s .440 correlation to next-season PPR scoring beat every individual metric I tested, including EPA/play (.375), FPOE/G (.366), Success Rate (.339), ANY/A (.313), CPOE (.254), and YPA (.237). Its .667 YoY correlation also dwarfed most of the sexier passing-efficiency metrics. It didn't win everywhere – Success Rate and Positive EPA rate actually captured a greater percentage of next-season Apex QBs – and Apex Score essentially tied simply using last year's FP as a predictor of next year's. But that's kind of the point: Apex Score isn't trying to invent a better EPA. It's trying to identify the weird combination of traits that exists before fantasy QBs become monsters.
It took a lot of trial and error, but I got there. Sure, my children feel as if they no longer know me, and I am fast-tracked for heart disease, but I think it was probably worth it.
Ugh. Why didn’t I learn to code?
FIVE QUARTERBACKS APEX SCORE LIKES BETTER THAN ADP
PATRICK MAHOMES - QB11
Seeing Patrick Mahomes at this low of an ADP is startling; he’s had a very durable reputation, even through 2023 and 2024 campaigns that saw him dip out of the fantasy top ten at QB. Drafters were rewarded for their patience last year, as Mahomes sprang back and performed as the QB4 before a Week 15 ACL tear sidelined him for the rest of the season.
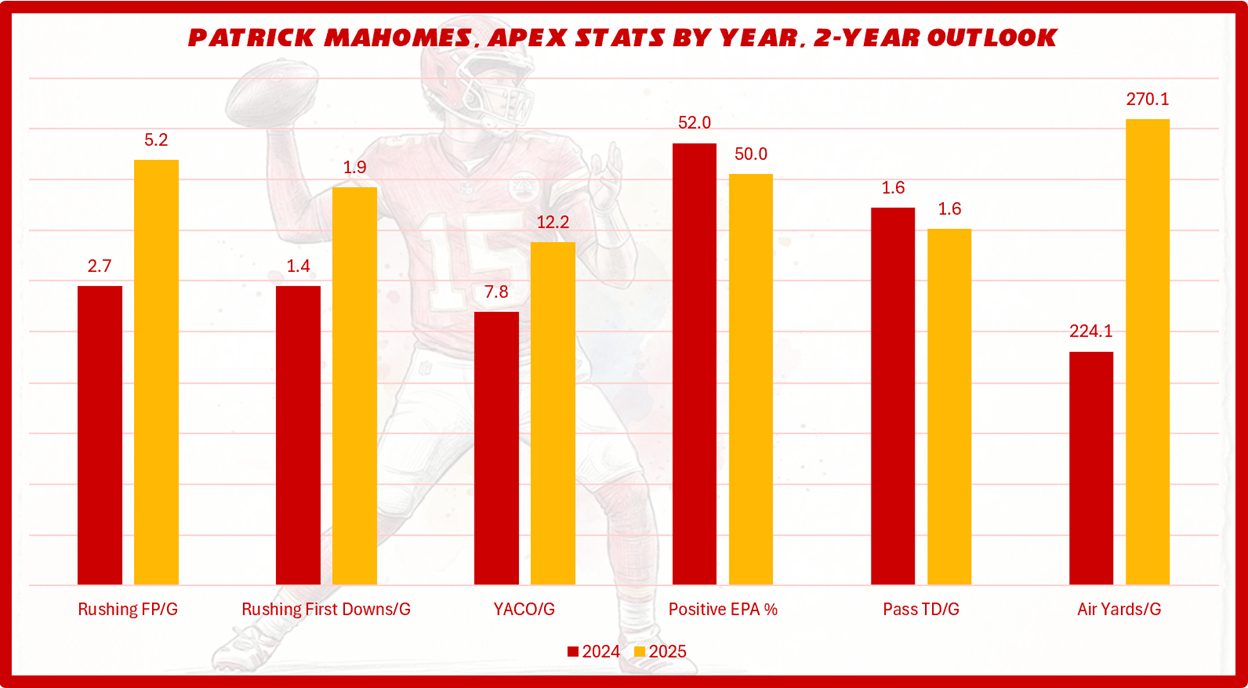
Mahomes did this by returning to the behaviors that made him a once-great fantasy asset, rushing far more and far more effectively, and taking bigger shots downfield. His AY/G (270.1, 4th), a hallmark of vintage Mahomes, were in the 91st percentile, and his rushing FP/G rose by 92.6% (5.2, 7th).
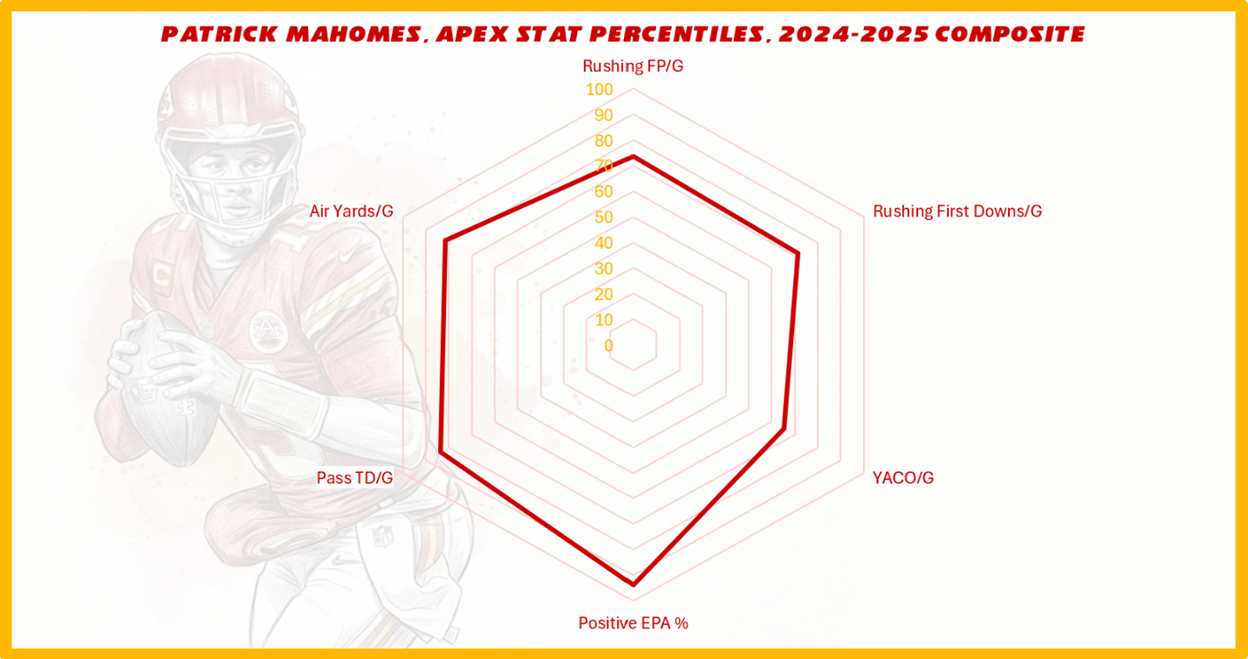
The ADP fade on Mahomes likely ties to his late-season ACL tear, which has people worried about the limits on his rushing workload and efficiency, which was already suspiciously anomalous pre-injury. The injury came late; Mahomes is 30, and his pass-catching core seems oddly stable relative to recent years, so that deduction seems reasonable. Mahomes himself stoked that fire, saying in a July press conference, "I think I ran a little bit too much last season in general, so I'll try to be better with that."
Add the Chiefs’ acquisition of RB Kenneth Walker, fatigue from Rashee Rice’s constant behavioral troubles, and the market, and you get the broader assumption that the Chiefs may try to reinvent themselves as a more rushing-based offense than they have been in the past.